Understanding filters
Filters narrow down your search result to only include the data you want to see.
| The new filter selection modal is part of the new answer experience. The new answer experience is on by default. If you have the classic answer experience on, your user interface and experience may be different from the experience described in this article. You can turn the new answer experience on or off individually from the Experience manager panel in your profile. If that option is not available, contact your administrator. |
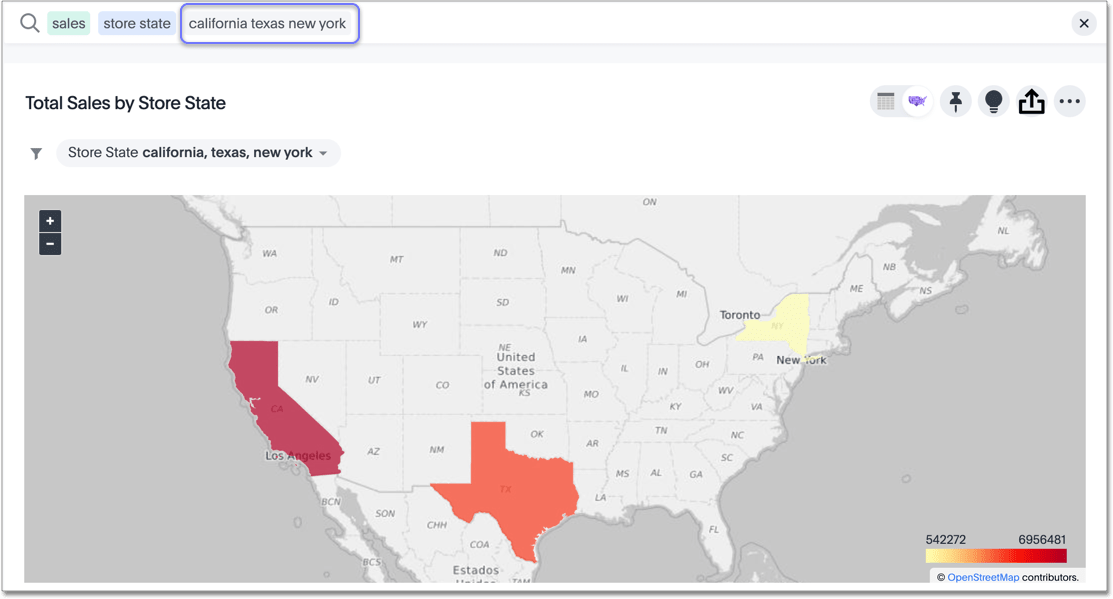
When you add a value to your search, it becomes a filter.
You can define filters on tables, views and worksheets.
When you add a filter, it is applied to the table, view, or worksheet, so the result set only shows rows that satisfy a set of parameters specified in the filter.
You can also set filters that are automatically used in every search you perform using a particular data source.
For example, you can exclude inactive customers records from your search result set.
To avoid typing status = inactive with every search you perform, you can use a filter.
The complex the filter is, the more useful it is to set on the data sources (for example,
status = inactive year = 2017 rating > 0).
To add a filter from the search bar:
-
Click in the search bar and type the value or values you want to include in the search.
Typing a value in the search bar acts as a filter.

You can also use date- and time-related keywords like
yesterday,after, andnext monthto filter your search. To see more keywords, refer to the keyword reference. -
Click outside of the search bar or push enter to apply your filter.
Simple filters can be applied to an answer, while Liveboard filters can be applied to all visualizations of a Liveboard. You can find out more about Liveboard filters in the Liveboards section.
Where filters appear in ThoughtSpot
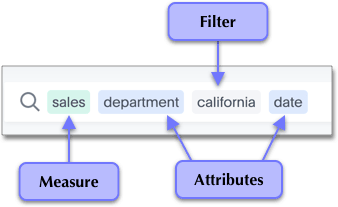
As you have seen with search, filters appear in grey boxes in the search bar.

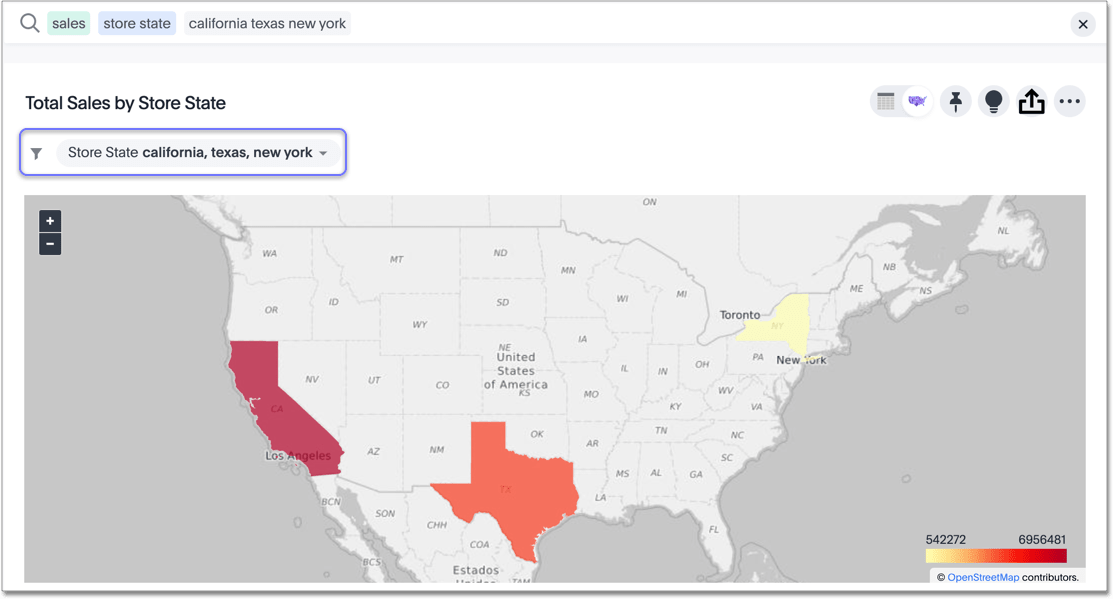
In an answer or a Liveboard, filters appear just under the title. For Liveboards, your filters apply to all worksheet-based visualizations in the Liveboard.

If you ever find that your search or Liveboard does not appear to contain all the data you want to see, check for any existing filters and remove them by clicking the X to see all the data.
| Filtering on NULL and empty values is a special case. You can find out more about how these values are represented and how to filter for them in About filtering on null, blank, or empty values. |
Simple filters
Simple filters can be applied to searches in a few different ways. You can use the search bar or choose Filter from the column header or axis label. You can apply simple filters to your search, whether it shows a table or a chart. Your filters remain part of the search even when you change the visualization type.
When adding a filter from the More menu icon ![]() , in the column header or by selecting a chart axis, numeric columns and text columns provide you with the ability to include or exclude values, and a checkbox selector for the values.
If the column contains a date, you can see a calendar selector when applying a filter.
This is also where you can apply bulk filters.
, in the column header or by selecting a chart axis, numeric columns and text columns provide you with the ability to include or exclude values, and a checkbox selector for the values.
If the column contains a date, you can see a calendar selector when applying a filter.
This is also where you can apply bulk filters.
Bulk filters
If you have a large worksheet or table with thousands or millions of rows, you may want to create bulk filters. You can paste in a list of filter values to include or exclude, without having to click the box next to each value in the filter selector.
Bulk filters can be very useful when you have a very large worksheet or table. You can use them to filter a large list of values easily. For example, this is useful if you want to only search on a list of products that your manager sent to you in an email. You can cut and paste those values into the bulk filter box to quickly generate a report or chart that includes only those items of interest.
You can create a bulk filter by pasting a list of values, separated by commas, semicolons, new lines, or tabs, into the bulk filter box. This allows you to easily search a large list of filters repeatedly.
Cascading filters
ThoughtSpot applies a specific logic to objects with more than one filter. For example, you may have a worksheet-level filter, such as country=US. While searching on that worksheet, you might want to add filters for specific cities. By default, ThoughtSpot limits your possible filter values to cities in the United States, since you have a worksheet-level US filter. The first filter you apply on an object always limits the available filter values you see for your second and third filters, and so on. This is because if you have a country=US filter, and try to add on a city=Paris,France filter, for example, this results in no data found.
Show unfiltered values
When you access the filters modal in a search by selecting the filter icon ![]() , you see an option to Show unfiltered values. This option relates to cascading filters. When you add a second filter to a search, ThoughtSpot only shows you values within the first filter you added. You may want to see all possible values without removing the first filter.
, you see an option to Show unfiltered values. This option relates to cascading filters. When you add a second filter to a search, ThoughtSpot only shows you values within the first filter you added. You may want to see all possible values without removing the first filter.
For example, you have a country=US filter on your search, but you want to see data for Paris, France. When you open the filters modal for city, you do not see Paris, France. You select Show unfiltered values and select Paris, France. Then you can delete the country=US filter. This is especially useful if you have many filters on an object, or if you are not sure what values the columns in your data have.
Worksheet filters
A worksheet filter gets applied every time that worksheet is used. This means that for any search involving a filtered worksheet, all worksheet filters are applied before the search is submitted. So results are always filtered, even if the specific terms searched do not include the column(s) that are filtered.
Use aggregate formulas as worksheet filters
Starting in ThoughtSpot release 6.2, you can use an aggregate formula as a worksheet filter.
This is useful when, for example, you only want your results to show a measure when the related attribute is greater than some number, or vice versa.
You may only want to see sales when the unique customer count is greater than 1, or you may only want to see a customer if the associated sales is greater than 0.
Rather than add that formula to every search, you can create a filter at the worksheet level.
To add an aggregated formula to a worksheet, follow these steps:
-
Add the formula to worksheet as a filter, and specify conditions in which it should apply.


