Spreadsheet View
Overview
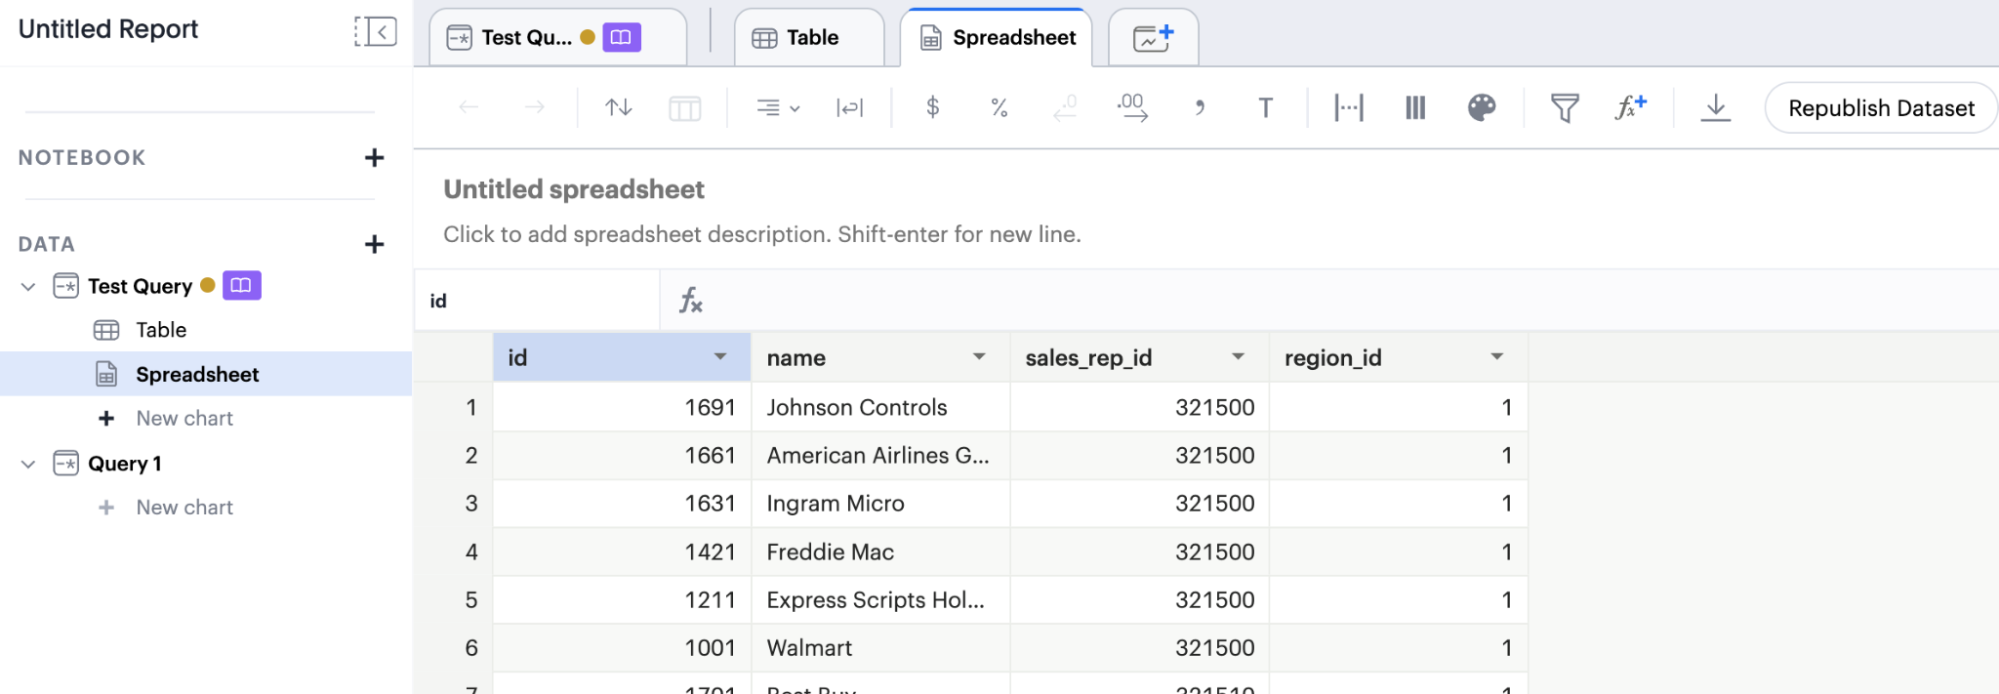
Spreadsheet in Analyst Studio provides a native, governed environment for high-stakes data transformation. Designed for financial and data analysts, this capability enables you to build advanced datasets directly on top of governed warehouse data without the security risks of exporting to external tools.
By merging the intuitive flexibility of a spreadsheet with enterprise-grade governance, you can scale basic datasets into sophisticated financial snapshots, encoding complex business logic that remains persistent and reusable.
When your transformation is complete, publish the dataset to the Data workspace, where it can be consumed by Liveboards and Spotter. If you continue working after publishing, the Republish option lets you update the published dataset in place.
Access the Spreadsheet view
The Spreadsheet interface is deeply integrated into the Analyst Studio reporting layer, allowing you to begin transformation from any data source.
- Flat file ingestion
-
Upload any flat file and land directly in the Spreadsheet view to profile and clean your data immediately. See Local file uploads, Google Sheets, and Excel workbook.
- Warehouse-connected data (SQL/Python)
-
From any successful query result in the SQL editor or Python Notebook, click Edit in spreadsheet to perform post-processing. See Querying CDW data.
- Existing datasets
-
Open any reusable dataset in a Report to add a new spreadsheet layer for metric enrichment. See Reusable datasets.
Use the Spreadsheet
The interface is optimized to maximize grid space while keeping advanced actions accessible.
Data integrity controls
- Undo
-
Reverts your last action. Analyst Studio supports a multi-level undo history, meaning you can step back through a series of changes sequentially.
- Redo
-
Restores an action that was previously undone. This is useful during what-if analysis when comparing two different states of your data.
Column sorting
- Global sort
-
Click the Sorting icon to open the advanced sort manager. You can add multiple sort levels (for example, sort by
[Region]ascending, then by[Spend]descending). Clear all applied sorts using the Clear sorts option in the toolbar. - Interactive header sort
-
Click any column header to toggle between ascending and descending order.
- Visual cues
-
A numerical indicator appears in the header (for example,
1or2) to show the hierarchy of your multi-column sort.
Conditional formatting
Conditional formatting allows you to visually highlight outliers, risks, or performance wins based on cell values. You can assign colors of different intensities to values depending on their relative position within a specified range. Access conditional formatting from the toolbar.
- Logic-based styling
-
Apply color scales (for example, green-to-red) or single-color highlights based on cell values or text (for example, highlight red if
Variance > 20%).
Numerical and financial formatting
- Currency support
-
Apply localized currency symbols with a single click. The system handles currency as a visual layer over numerical data, preserving the ability to perform math on the underlying values.
- Percentage conversion
-
Instantly convert decimal ratios (for example,
0.85) into readable percentages (85%). - Decimal precision management
-
Use Increase Decimals and Decrease Decimals controls for financial rounding. This is useful for moving between high-level millions (0 decimals) and granular per-unit costs (4 or more decimals).
- Standard number formatting
-
Toggle between scientific, accounting, and comma-separated formats to match corporate reporting standards.
Text formatting and cell styling
- Text alignment
-
Use the alignment control (Left, Center, or Right) for optimal grid readability.
- Text wrapping
-
Toggle between Clip (keeps row height uniform) and Wrap (expands row height to show all text content). This is useful for long memo fields or transaction descriptions.
- Text formatting
-
Click the Format (T) icon. Options change based on the data type of the selected column:
-
Numerical: Currency, Percentage, Scientific, and precision controls (Increase/Decrease Decimals).
-
String: Case transformation (Upper/Lower) and text cleanup.
-
URL: Format a field as a URL from the Format options in the top toolbar or using the format option in the field context menu.
-
Basic hyperlink: Display the URL as text, text with underline, or as an icon. This formatting creates hyperlinks that serve as references to other web pages or resources.
-
Custom: Offers advanced options to tailor the display and functionality of hyperlinks, including customizing the displayed link text and using a reference field as the URL address.
-
-
Cell and grid organization
- Cell style settings
-
The Cell Style modal provides the following options:
-
Alternating row colors: Improves readability for wide financial models.
-
Gridline toggles: Switch between full grid, horizontal only, or no gridlines.
-
Text wrapping: Toggle the Wrap Text option to ensure long memo fields do not break the grid’s visual flow.
-
- Column sizing
-
-
Size to fit: Automatically calculates the optimal column width based on the longest string in the current view.
-
Manual resize: Hover over the boundary of a column header and drag to your desired width.
-
Column management and schema control
The Select Columns modal is the primary tool for shaping the dataset output.
- Hide/Unhide
-
Toggle the visibility of columns in bulk. Hide technical system IDs to focus the grid on business metrics.
- Reorder via drag-and-drop
-
Grab the handle next to any column name in the list and drag it to change its position in the grid.
Filter by data type
Filtering in Spreadsheet is a logic-driven engine that adapts its behavior based on the column’s data type.
Numerical filtering
When filtering numeric columns, the system provides three filter modes:
- Range of values
-
Set a Between, Greater than, or Less than boundary (for example, show only transactions over $50,000).
- Individual values
-
A checklist of every unique number in the column, allowing you to exclude specific amounts.
- Top/Bottom analysis
-
Apply a Top N or Bottom N filter (for example, show the top 10 cost centers by spend).
Publish and republish
- Publish
-
Click Publish Dataset in the top right corner of the Spreadsheet view. In the Publish to the Data workspace window, enter the dataset name and click Publish. The dataset is published as a table in the Data workspace, ready for Liveboards and Spotter.
- Republish
-
If you make further changes in the Spreadsheet — or the source dataset itself changes — the Republish Dataset option appears. Republishing updates the previously published dataset in place, so dependent Liveboards and Spotter content continue to work. This applies to spreadsheets layered on SQL query results, Google Sheets, Excel workbooks, and local files.
Calculated fields
Calculated fields enable you to create derived columns in Spreadsheet by applying expressions to existing dataset columns.
Using calculated fields, you can:
-
Derive new metrics from existing columns
-
Apply business logic and classification rules
-
Perform mathematical and statistical calculations
-
Transform and standardize data values
-
Handle missing data safely
-
Prepare datasets for downstream analytics and AI workflows
Calculated field structure
Spreadsheet calculated fields are composed of four elements:
| Element | Description |
|---|---|
Column references |
Existing dataset fields used as inputs |
Operators |
Mathematical or logical operations |
Functions |
Predefined operations applied to values |
Literal values |
Constants such as numbers, strings, or dates |
Column reference syntax
All dataset columns must be referenced using square brackets:
[COLUMN_NAME]Examples:
[Revenue]
[Customer Name]
[Order Date]
Columns with spaces are supported because the bracket syntax preserves the full column name:
[Gross Revenue]Operators
Arithmetic operators
| Symbol | Name | Description | Example |
|---|---|---|---|
|
Addition |
Adds numeric values |
|
|
Subtraction |
Subtracts values |
|
|
Multiplication |
Multiplies values |
|
|
Division |
Divides values |
|
|
Modulus |
Returns remainder |
|
Comparison operators
| Symbol | Name | Description | Example |
|---|---|---|---|
|
Equal |
True if values match |
|
|
Not equal |
True if values differ |
|
|
Greater than |
True if left value is larger |
|
|
Less than |
True if left value is smaller |
|
|
Greater or equal |
True if left value is larger or equal |
|
|
Less or equal |
True if left value is smaller or equal |
|
Logical operators
| Operator | Description | Example |
|---|---|---|
|
Returns true if both conditions are true |
|
|
Returns true if either condition is true |
|
|
Negates a condition |
|
|
Tests if a value exists in a list |
|
|
Tests if a value does not exist in a list |
|
Conditional logic
Conditional calculated fields allow you to encode decision rules directly within the dataset.
Syntax:
IF condition THEN result ELSE result ENDExample:
IF [Revenue] > 50000
THEN 'High Value'
ELSE 'Standard'
END
Common use cases:
-
Revenue banding
-
Risk classification
-
Operational flags
-
Customer segmentation
Functions
Numeric functions
| Function | Description | Example |
|---|---|---|
|
Returns absolute value |
|
|
Rounds a numeric value |
|
|
Rounds a value upward |
|
|
Rounds a value downward |
|
|
Raises a number to a power |
|
|
Returns the square root |
|
|
Returns the remainder |
|
|
Returns the exponential value |
|
|
Returns the natural logarithm |
|
Date functions
| Function | Description | Example |
|---|---|---|
|
Calculates the difference between two dates |
|
|
Adds an interval to a date |
|
|
Extracts the year from a date |
|
|
Extracts the month from a date |
|
|
Extracts the day from a date |
|
|
Extracts the week number |
|
|
Extracts the quarter |
|
|
Returns the current timestamp |
|
String functions
| Function | Description | Example |
|---|---|---|
|
Concatenates strings |
|
|
Converts text to lowercase |
|
|
Converts text to uppercase |
|
|
Returns the string length |
|
|
Removes leading and trailing whitespace |
|
|
Returns a left substring |
|
|
Returns a right substring |
|
|
Extracts a portion of a string |
|
|
Replaces a substring |
|
Null handling functions
| Function | Description | Example |
|---|---|---|
|
Replaces null with zero |
|
|
Returns a fallback value if null |
|
|
Tests if a value is null |
|
|
Returns the first non-null value |
|
Aggregate functions
| Function | Description | Example |
|---|---|---|
|
Returns the sum of values |
|
|
Returns the average value |
|
|
Returns the smallest value |
|
|
Returns the largest value |
|
|
Counts rows |
|
|
Counts distinct values |
|
Cumulative functions
| Function | Description | Example |
|---|---|---|
|
Running sum |
|
|
Running average |
|
|
Running maximum |
|
|
Running minimum |
|
Calculated field examples
Revenue margin
[Revenue] - [Cost]Profit percentage
([Revenue] - [Cost]) / [Revenue]Customer value classification
IF [Revenue] > 50000
THEN 'High Value'
ELSE 'Standard'
END
Delivery delay
DATEDIFF('day',[Expected Delivery],[Actual Delivery])Cost center priority
IF [Spend] > 10000
THEN 'Priority Action'
ELSE 'Normal'
END
Analytical modeling workflow
Spreadsheet supports a layered modeling workflow where derived columns progressively transform raw data into actionable insights:
Raw Dataset → Derived Metrics → Feature Engineering → Business Rules → Analytics & AI Queries
Best practices
- Use descriptive column names
-
Choose names that communicate meaning clearly.
Good examples:
revenue_margin,customer_segment,priority_actionAvoid generic names such as
calc1,score2, orvalue3. - Build calculated fields incrementally
-
Start with base metrics and add additional derived columns step by step.
- Handle null values safely
-
Wrap columns in null-handling functions when necessary.
ZN([Revenue]) - Keep business logic readable
-
Decision rules should be understandable by both analysts and business stakeholders.
IF [Spend] > 10000
THEN 'High Priority'
ELSE 'Standard'
END
Summary
Spreadsheet calculated fields enable analysts to extend datasets with derived analytical columns. Using calculated fields, you can:
-
Transform raw data
-
Compute business metrics
-
Implement operational rules
-
Prepare AI-ready datasets
-
Build analytical models directly inside Analyst Studio
This approach combines spreadsheet-style flexibility with warehouse-scale data processing, allowing you to perform complex transformations without exporting data outside the governed analytics platform. When ready, publish your dataset to the Data workspace and use Republish to keep the published version in sync as your model evolves.