Querying CDW data
Overview
The Report is where analysis happens in Analyst Studio. Navigate to the Data workspace and select Analyst Studio, then click New in the upper right corner of the window to create a new Report and get started. All new Reports are automatically added to your personal Collection.
After creating a Report, you are taken to the editor to write your first query.
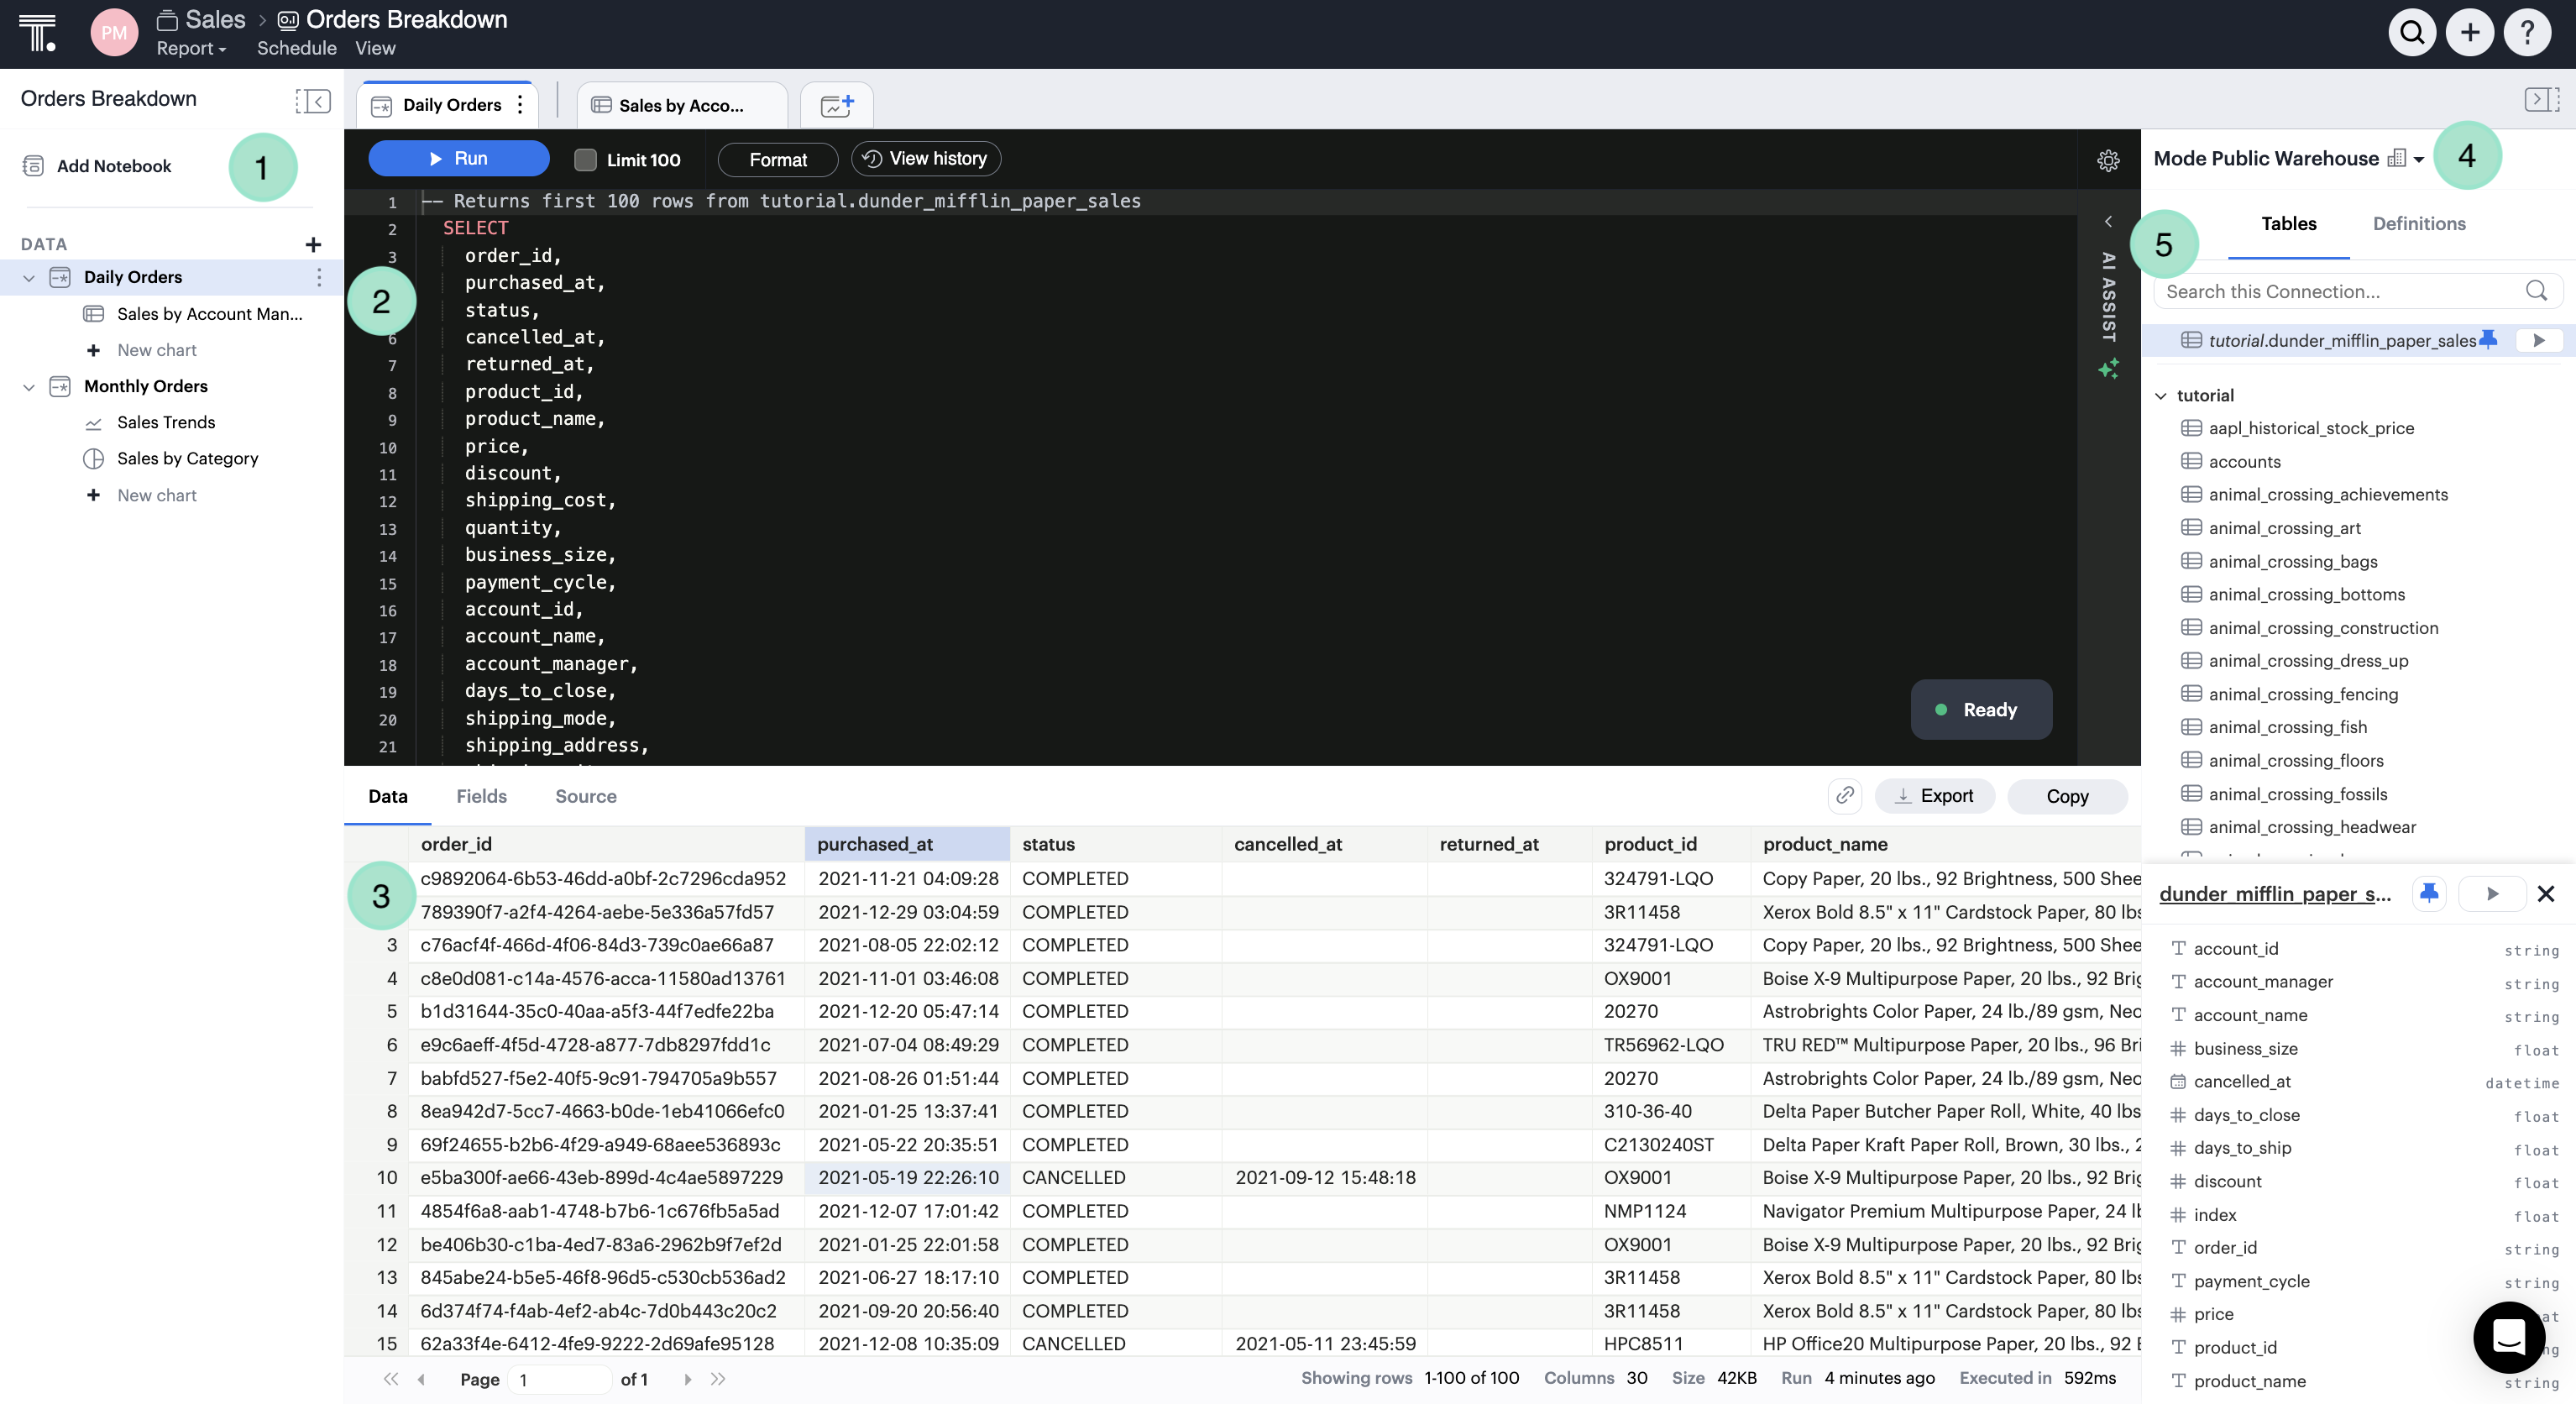
The query editor contains a number of resizable sections that should be familiar to you if you have worked with other SQL clients before:
- Report navigation panel
-
Use the navigation panel to quickly navigate between the Report Builder, a Python/R Notebook, and the data section. Within the data section, which you can drag to resize, you will see:
-
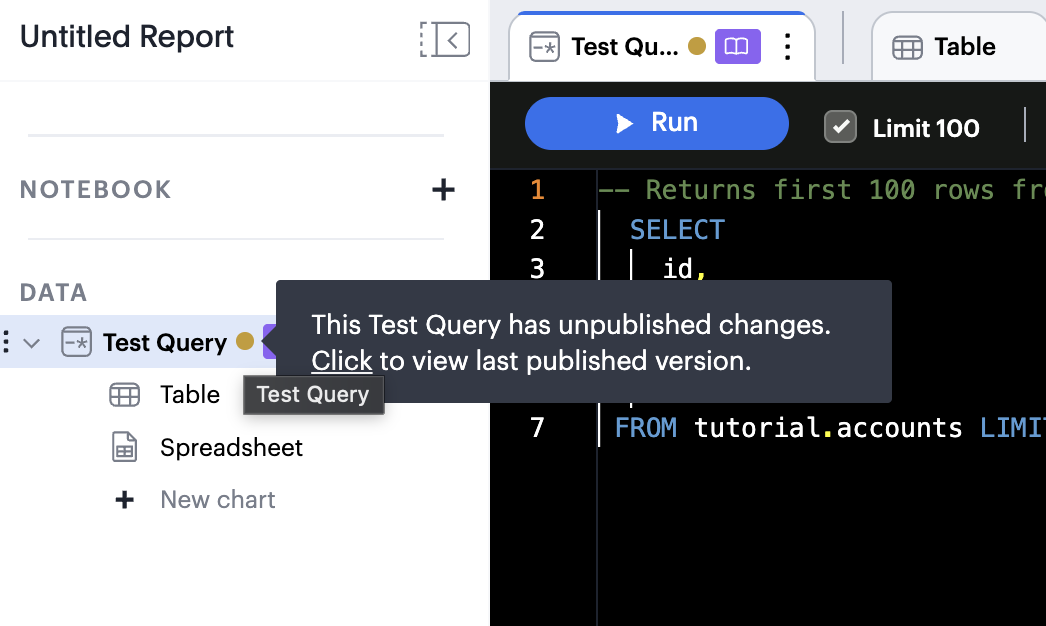
Every query and reusable Dataset in the Report. Click on a query to select it and edit its code. A small dot next to a query name indicates unpublished draft changes — edits made after the query was last published. Click Republish to apply them to the Data workspace. Use the context menu to rename, duplicate, delete, reorder, and more. To add a new query or Dataset, click the plus button to the right of the data header. Drag and drop to reorder queries and Datasets.
-
Each visualization that you build using a query’s data. Click the plus button below your chart to add a new one.
To tell which charts you have added to the Report Builder, look for a blue checkmark symbol within each chart’s icon.
-
- Code editor
-
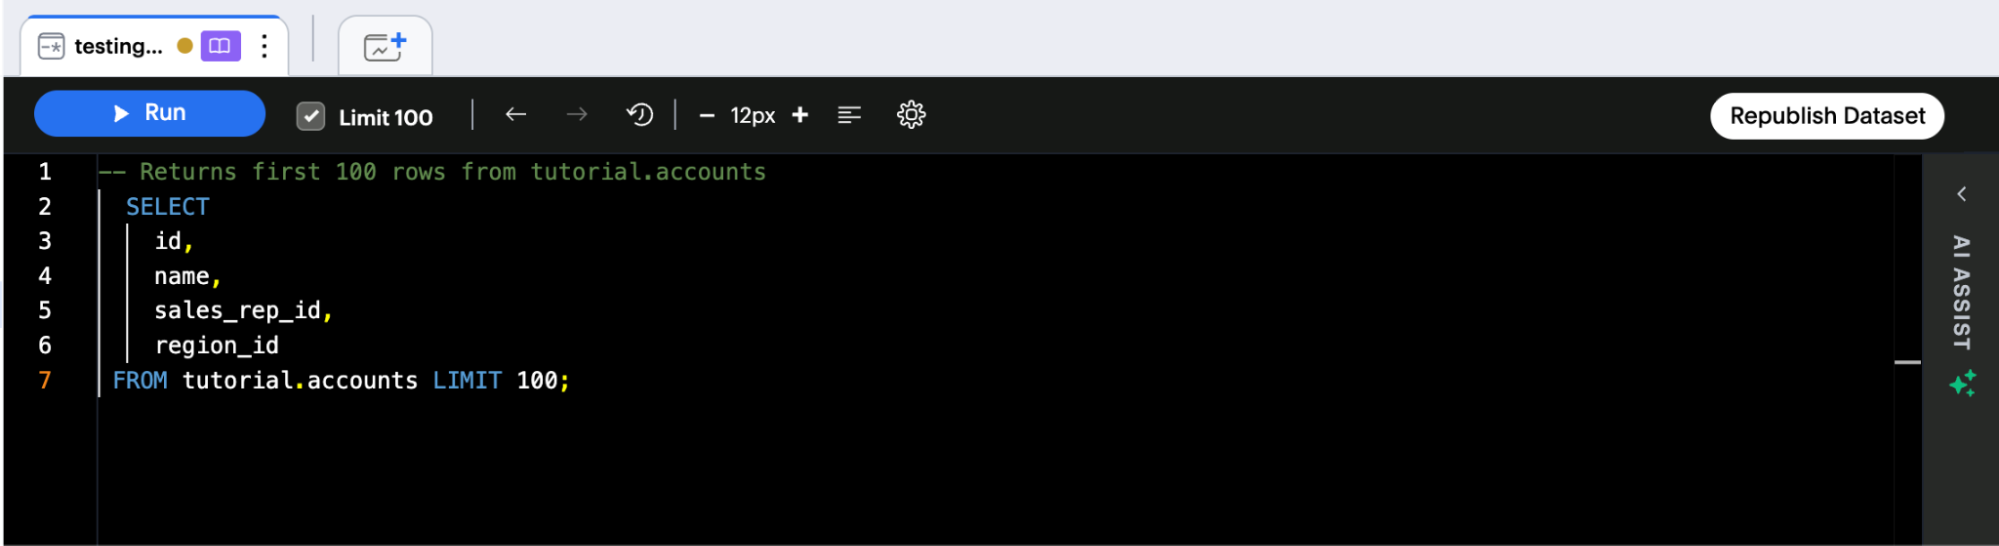
Compose your SQL code here. The code editor is powered by Ace and supports most Ace keyboard shortcuts (see SQL keyboard shortcuts) and context-aware autocomplete for database objects (for example, column and table names), SQL keywords, and Definitions.
Across the top of the query editor are the following controls:
- Run
-
Executes all code in the editor. Select a portion of your code before clicking Run to execute only that portion.
- Limit 100
-
Checked by default. Automatically appends
LIMIT 100to your query so no more than 100 rows are returned in the result set. This speeds up exploratory querying but should be unchecked when you want to see a complete result set. - Format SQL
-
Automatically indents and formats your SQL code. Click again to revert if you do not like the formatting.
- Publish
-
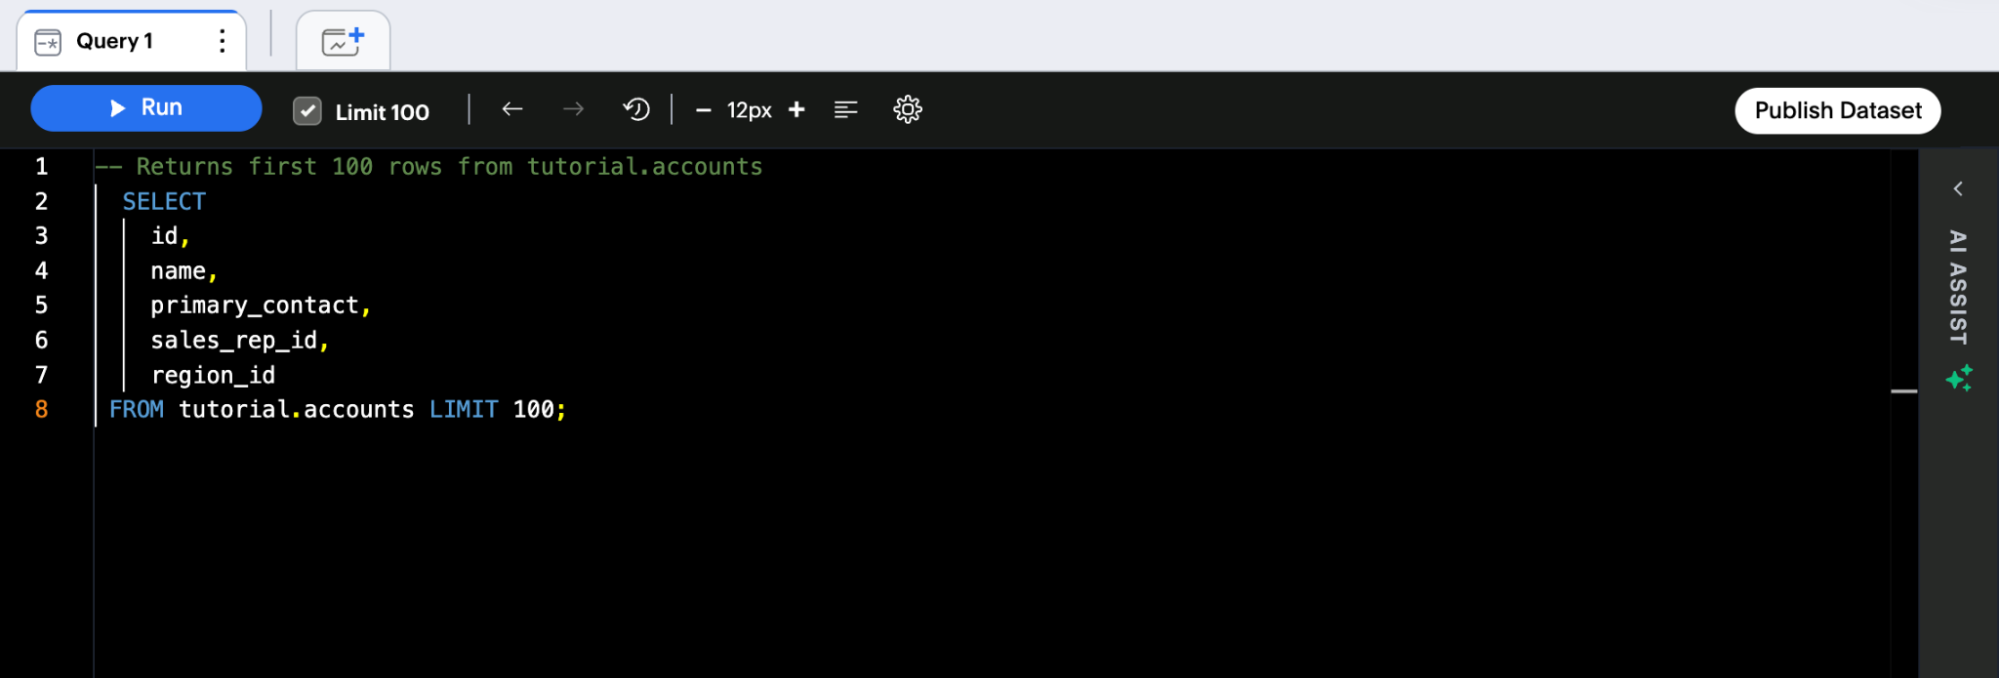
Publishes the query result to the Data workspace as a Dataset, where it can be consumed by Liveboards and Spotter. After the first publish, the option reads Republish whenever there are unpublished changes. See Publishing query results to the Data workspace.
- View History
-
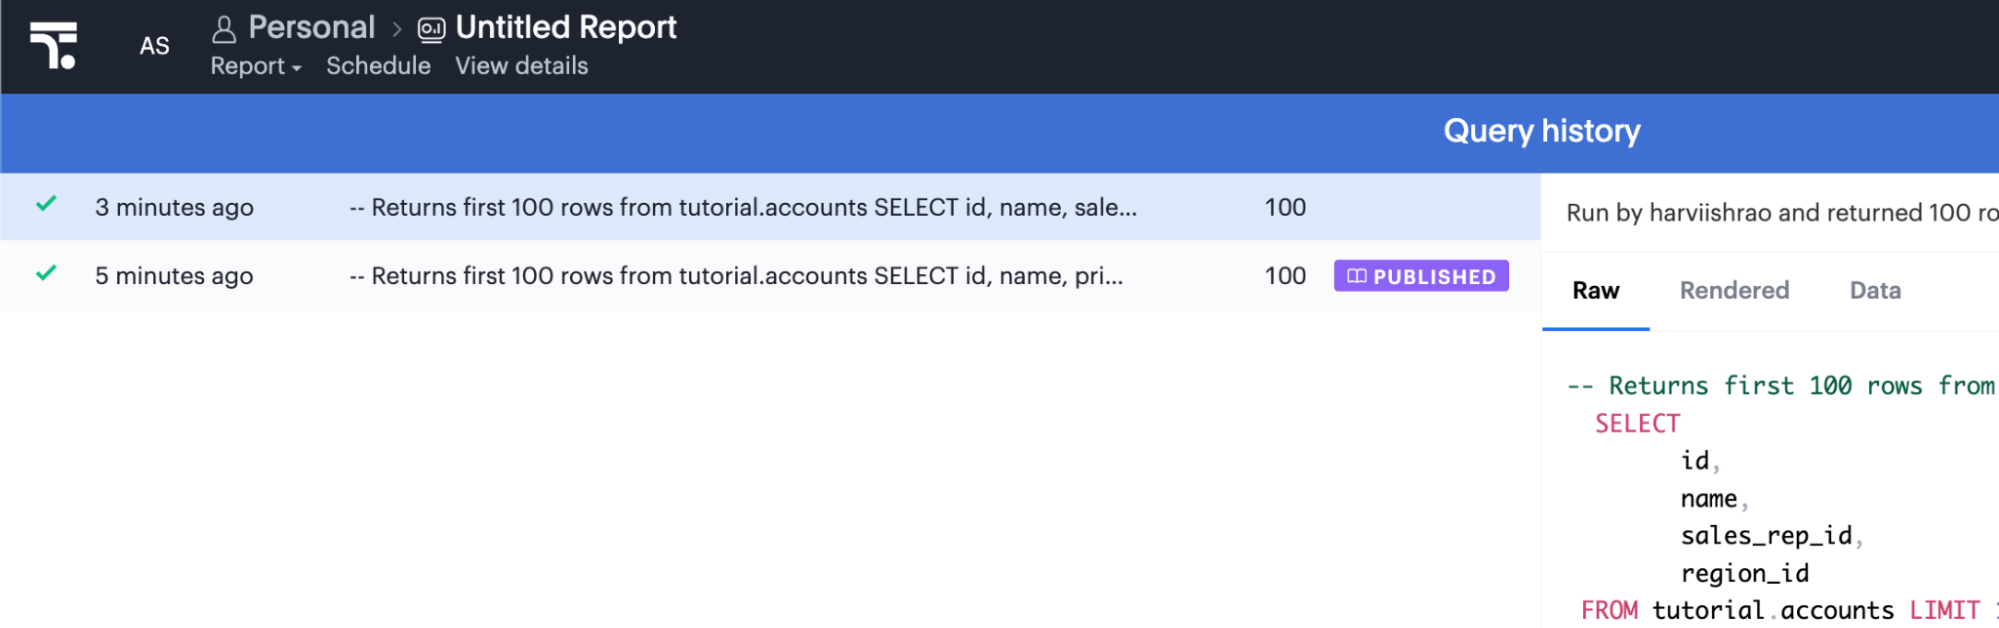
The running history of each query execution, including the raw code (as written), rendered code (SQL sent to the database after processing all Liquid code), and any data that was returned. Select a historical query run and click Open to replace the code currently in the query editor with the code from that run. The history also indicates the last published version of the query, so you can compare your current draft against what is live in the Data workspace.
- Editor Settings
-
Toggle settings for the code editor on or off to personalize the editor to fit your preferences. Choose between light and dark modes, side-by-side or stacked panels, Limit 100 on or off by default, and other autocomplete settings. To turn autocomplete on or off, toggle the switch in Autocomplete Settings, or press Command + Option + A (Mac) or Control + Alt + A (PC) in the editor.
- Data view
-
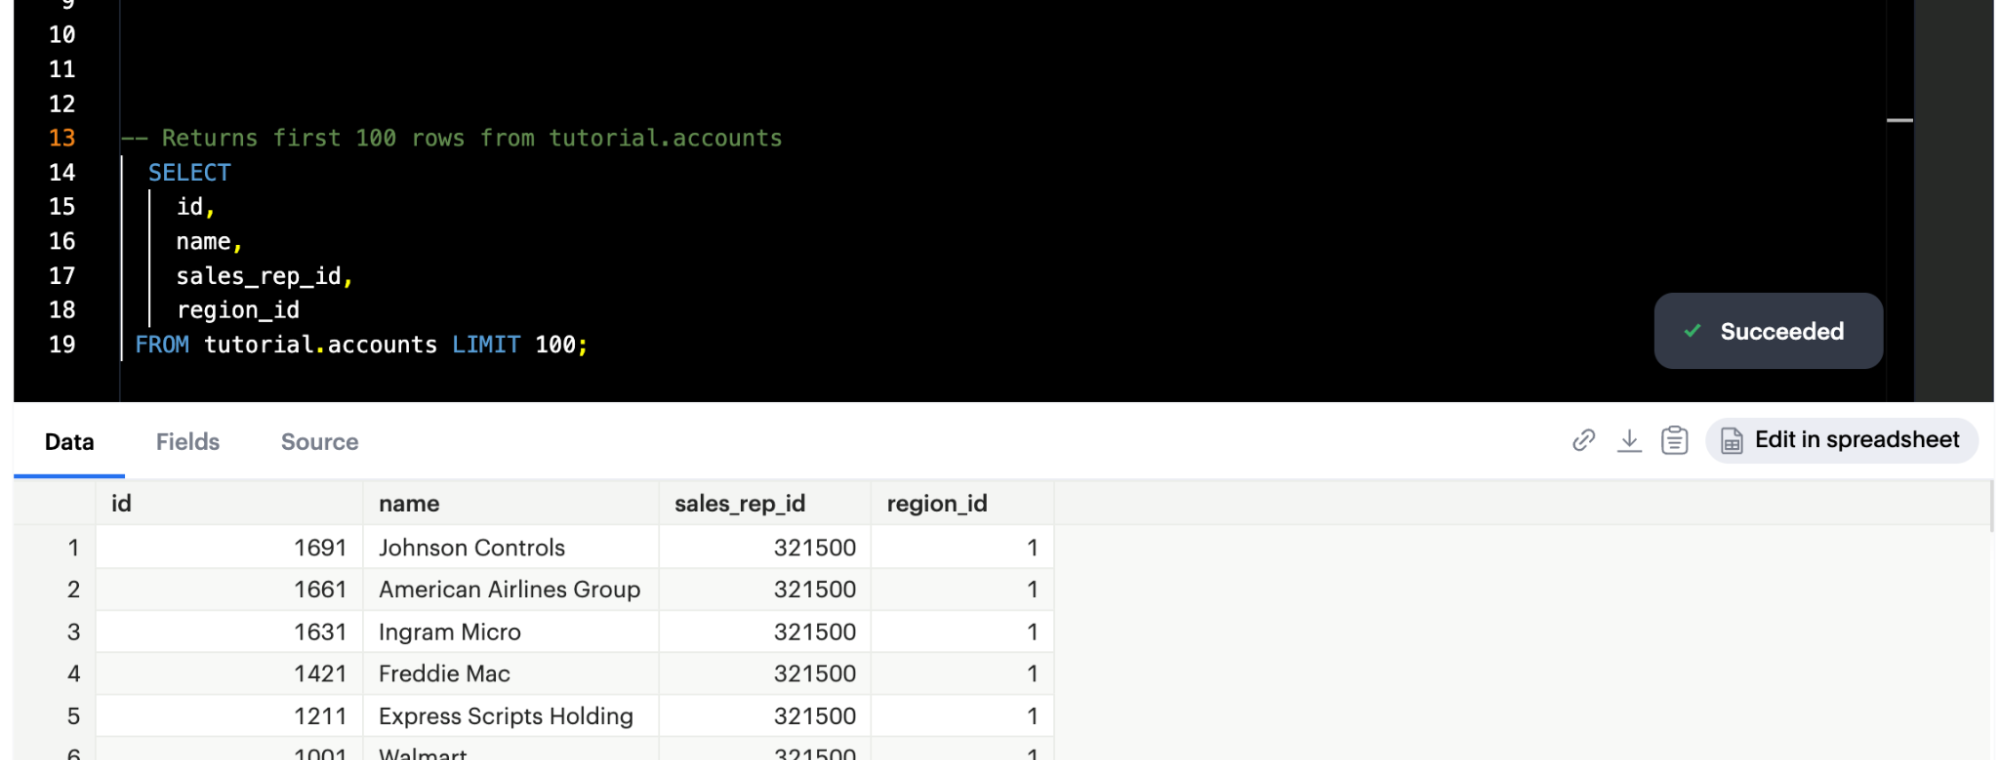
After you successfully execute a SQL query, the tabular results, fields, and syntax are displayed here. You can drag to resize the panel.
-
Use the Data tab to consume your results, share the URL to that specific query, export the raw query data as a CSV, or copy the data to the clipboard. You can also click Edit in spreadsheet to open the result in the Spreadsheet view for post-processing — cleaning, calculated fields, and formatting — and publish or republish the dataset from there.
-
Use the Fields tab to view metadata about your fields.
-
Use the Source tab to toggle between the raw and rendered SQL that was executed at the time of the run, and copy the syntax to the clipboard.
Quickly expand or collapse the Data view by double-clicking its header.
-
- Database dropdown
-
Tells Analyst Studio which connection to query and which database’s schemas and tables to display in the schema browser.
- Schema Browser
-
A visual representation of the schemas, tables, and columns that are available in the selected database. You can drag to resize the panel.
Publishing query results to the Data workspace
Any successful query result can be published to the Data workspace as a Dataset and consumed by Liveboards or Spotter.
-
Run your query.
-
Click Publish Dataset at the top right of the query pane.
-
In the Publish to the Data workspace window, enter a name and click Publish.
|
Publish replaces the previous Create a Dataset from this Query option and its optional publish toggle and Promote step. |
- Draft changes and republishing
-
After publishing, changes to the SQL are not applied to the published Dataset automatically. They are saved in a draft state, indicated by a small dot next to the query. Click Republish to bring the published Dataset up to date.
- Query history
-
Use View History to review past executions and see the last published version.
For publish/republish behavior of reusable Datasets, see Reusable Datasets. To join reusable datasets across sources, see Query datasets.
+
Schema browser
The schema browser lets you explore the schemas, tables, and columns in the selected database. Drag to resize the panel to fit longer table names.
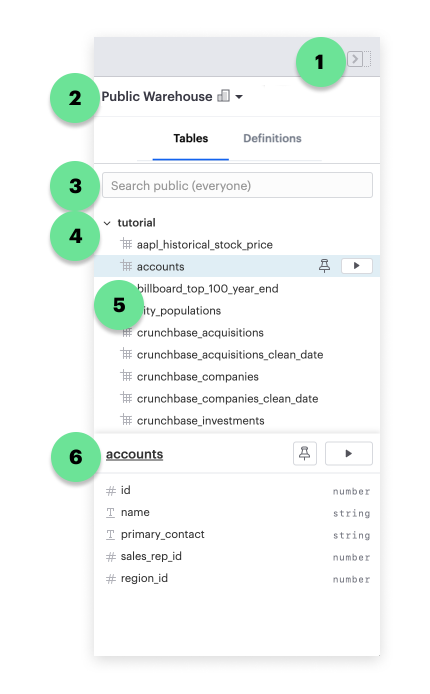
- Show/hide
-
Click to hide or reveal the schema browser.
- Selected data connection
-
Click to reveal and select from a list of data connections. The schema browser shows tables for the database displayed here. The query also executes against this connection.
- Search
-
Type to search for table names in the selected database.
- Pinned
-
Tables you pin are shown at the top of the schema browser so you can easily find them. Tables are automatically pinned as you query them. To pin a table, hover over its name and click the pin icon on the right.
- Tables
-
All the tables that you have access to for a given data connection are listed here, organized by schema. Click the play button next to any table name to quickly return a sampling of 100 rows from that table.
- Columns
-
A list of all the columns in a selected table. The symbol next to the column name refers to the type of data in that column (for example, varchar, float, date, and so on).
|
The play button is not available for certain database types, including those that charge on a per-query basis (for example, Google BigQuery, Amazon Athena, and so on). |
Querying multiple data sources
Analyst Studio Reports can contain multiple queries, and each individual query can retrieve data from any one connected database. Different visualizations, each with data from different databases, can exist side-by-side within the same Report.
You can also join these query data after you have created a reusable dataset from them. Reusable datasets from disparate sources built using SQL, or flat files, can be joined using Query datasets.
You can combine result sets from multiple databases and visualize the combined data using Python or R in the Notebook, or using JavaScript in the HTML editor.
Complex and multi-statement queries
Analyst Studio performs very little translation or manipulation of your code before sending it to your database for execution.
This means that Analyst Studio can execute any code that is valid for your database.
Given the right database permissions, you are not limited to SELECT statements.
You can do anything your database allows, including:
-
Creating, dropping, and altering tables and views
-
INSERT,DELETE, andUPDATEoperations -
Creating, modifying, or employing user-defined functions
Analyst Studio executes code containing multiple SQL statements, separated by semicolons. For example, the following code is valid in Analyst Studio:
SET TIME ZONE 'UTC';

SET search_path TO schema_name;

CREATE TEMP TABLE temp1 AS
(
  SELECT email, company, LOCALTIME AS date FROM customers
);

SELECT * FROM temp1;
Extending SQL with Liquid
Overview
You can extend the power of your SQL queries by using the open source Liquid template language. Using Liquid, the SQL behind your Analyst Studio Reports can be manipulated at Report run time using loops, if/then statements, and other advanced structures that might be difficult or impossible to do in SQL alone.
Whenever a query is executed in an Analyst Studio Report, Liquid code (if present) is evaluated first before the code is sent to your database for execution as SQL. Liquid code is composed of the following elements:
- Objects
-
Objects contain attributes used to render dynamic content into your SQL query at run time. Objects are wrapped in double curly brackets:
{{ … }}. - Filters
-
Filters are simple methods that modify the output of numbers, strings, variables, and objects. They are placed inside object tags
{{ }}and denoted with a|character. - Tags
-
Tags make up the programming logic (for example,
if/else,for, and so on) that tells your code what to do. They are wrapped in a single curly bracket and a percent sign:{% … %}. Tags do not themselves produce output rendered into your query, but they may instruct Analyst Studio to render, ignore, repeat, or otherwise modify specific lines of SQL code.
Full documentation on what is possible with Liquid is available on the Shopify help site and the Liquid GitHub repository.
Common techniques
Variables
Use variables in Liquid to make your code more extensible and maintainable.
Declare a variable using the assign method.
For example:
SELECT * FROM employee_table WHERE favorite_food = '{{ fav_food }}'

{% assign fav_food = 'peaches' %}
The above code renders into the following code for execution against the database:
SELECT * FROM employee_table WHERE favorite_food = 'peaches'|
Variables are scoped only to the query in which they are declared using |
If/else
Use if/else statements and other control flow tags to change your SQL code dynamically in response to inputs from variables or parameters.
In the following example, the query executed against the database differs depending on the value of the car_type variable:
{% assign car_type = 'trucks' %}

SELECT *
{% if car_type == 'trucks' %}
  FROM truck_table
{% elsif car_type == 'cars' %}
  FROM car_table
{% endif %}
If car_type = 'trucks', the following code is executed:
SELECT * FROM truck_tableIf car_type = 'cars', the following code is executed:
SELECT * FROM car_tableLoops
Loops and other Liquid iteration tags can be used to programmatically generate lists of variables, join statements, columns to select, unions, and other constructs.
The query below shows a simple example of a for loop:
SELECT *
  FROM sports_teams

{% for i in (1..4) %}
  LEFT JOIN draft_picks d{{i}}
    ON d{{i}}.team_name = sports_teams.team_name
  AND d{{i}}.round = {{i}}
{% endfor %}
The above code joins the draft_picks table to the teams table four times.
Each join is assigned a distinct alias (d1 through d4) and a different condition (the round number of the draft pick).
The rendered code sent to the database for execution is:
SELECT *
  FROM sports_teams
  LEFT JOIN draft_picks d1 ON d1.team_name = sports_teams.team_name AND d1.round = 1
  LEFT JOIN draft_picks d2 ON d2.team_name = sports_teams.team_name AND d2.round = 2
  LEFT JOIN draft_picks d3 ON d3.team_name = sports_teams.team_name AND d3.round = 3
  LEFT JOIN draft_picks d4 ON d4.team_name = sports_teams.team_name AND d4.round = 4
In some cases, you may want the last iteration of the loop to produce a different result than other iterations.
For example, when creating a comma-separated list of strings, you may want a comma after every value except the last one.
Liquid includes a forloop.last statement for this purpose:
WHERE name IN (
  {% for name in list_of_names %}
    '{{name}}'
    {% unless forloop.last %}
      ,
    {% endunless %}
  {% endfor %}
)
For every iteration of the loop except the last one, forloop.last returns false.
Therefore, the value in the unless statement — a comma — is added to your query after every name except the last one.
Array variables
Typically, for loops cycle through collections of values, such as iterable objects in Python or vectors in R.
Liquid does not allow you to create arrays the same way as in most languages (for example, list = ['candy','beans']).
To create an array you can iterate over in a for loop, use the split filter on a delimited string and assign the result to a variable.
For example:
{% assign food = 'candy,beans,pizza' | split: ","  %}

{% for item in food %}
  LEFT JOIN types_of_food {{ item }}
    ON {{ item }}.type = '{{ item }}'
{% endfor %}
The above code converts the comma-delimited string 'candy,beans,pizza' to an array and assigns that array to the variable food.
The for loop then iterates over each value in the array variable food.
Comments
Use {% comment %} and {% endcomment %} tags to instruct Analyst Studio to ignore whatever text or code is written between them.
SQL keyboard shortcuts
Analyst Studio’s SQL editor runs using the Ace Editor library. Most default Ace keyboard shortcuts are enabled, along with Analyst Studio-specific shortcuts.
General
| Action | Mac | PC |
|---|---|---|
Run query |
Cmd + Return |
Ctrl + Enter |
Save query |
Cmd + S |
Ctrl + S |
Switch to Report Builder |
Ctrl + I |
Alt + I |
Indent |
Tab |
Tab |
Outdent |
Shift + Tab |
Shift + Tab |
Add multi-cursor above |
Ctrl + Option + Up |
Ctrl + Alt + Up |
Add multi-cursor below |
Ctrl + Option + Down |
Ctrl + Alt + Down |
Undo |
Cmd + Z |
Ctrl + Z |
Redo |
Cmd + Y |
Ctrl + Y |
Toggle comment |
Cmd + / |
Ctrl + / |
Change to lowercase |
Ctrl + Shift + U |
Ctrl + Shift + U |
Change to uppercase |
Ctrl + U |
Ctrl + U |
Fold selection |
Cmd + F1 |
Ctrl + F1 |
Unfold |
Cmd + Shift + F1 |
Ctrl + Shift + F1 |
Find |
Cmd + F |
Ctrl + F |
Replace |
Cmd + Option + F |
Ctrl + H |
Find next |
Cmd + G |
Ctrl + K |
Find previous |
Cmd + Shift + G |
Ctrl + Shift + K |
Open autocomplete |
Ctrl + Space |
Ctrl + Space |
Selection
| Action | Mac | PC |
|---|---|---|
Select all |
Cmd + A |
Ctrl + A |
Select left |
Shift + Left |
Shift + Left |
Select right |
Shift + Right |
Shift + Right |
Select word left |
Option + Shift + Left |
Ctrl + Shift + Left |
Select word right |
Option + Shift + Right |
Ctrl + Shift + Right |
Select to line start |
Cmd + Shift + Left |
Alt + Shift + Left |
Select to line end |
Cmd + Shift + Right |
Alt + Shift + Right |
Select up |
Shift + Up |
Shift + Up |
Select down |
Shift + Down |
Shift + Down |
Duplicate selection |
Cmd + Shift + D |
Ctrl + Shift + D |
Go to
| Action | Mac | PC |
|---|---|---|
Go to word left |
Option + Left |
Ctrl + Left |
Go to word right |
Option + Right |
Ctrl + Right |
Go line up |
Ctrl + P |
Up |
Go line down |
Ctrl + N |
Down |
Go to line start |
Cmd + Left |
Alt + Left |
Go to line end |
Cmd + Shift + Left |
Alt + Right |
Go to start |
Cmd + Up |
Ctrl + Home |
Go to end |
Cmd + Down |
Ctrl + End |
Line operations
| Action | Mac | PC |
|---|---|---|
Remove line |
Cmd + D |
Ctrl + D |
Copy lines down |
Option + Shift + Down |
Alt + Shift + Down |
Copy lines up |
Option + Shift + Up |
Alt + Shift + Up |
Move lines down |
Option + Down |
Alt + Down |
Move lines up |
Option + Up |
Alt + Up |
Remove to line end |
Ctrl + K |
|
Remove to line start |
Cmd + Backspace |
Alt + Backspace |
Remove word left |
Option + Backspace |
Ctrl + Backspace |
Remove word right |
Option + Delete |
Ctrl + Delete |
FAQs
The schema browser is empty or missing tables I know to be in the database
The tables listed in Analyst Studio’s schema browser may differ from what you expect for the following reasons:
- The database was recently connected or updated
-
Analyst Studio’s schema browser updates once daily at 10:05 AM UTC / 2:05 AM PST / 5:05 AM EST. If you recently connected a new database, an automatic update is triggered and the schema browser may appear blank for 30 minutes or more until the refresh completes. If new tables were added to an existing database, you need to manually trigger a schema refresh to see the updates. To do this, click the menu button in the upper right corner of the schema browser and click Refresh.
New tables and databases can be queried immediately, regardless of whether they appear in the schema browser.
- You do not have permission to see the missing tables
-
Analyst Studio connects to your database as a database user. This user, which is defined by your database, may not have access to all tables in your database. If you think this might be the case, try querying one of the tables that is missing from the schema browser. If the query returns a permission error, this is likely the cause.
Resolve this issue by granting the database user access to the missing tables. These configurations are defined by the database and typically managed by database admins. Permissions cannot be changed directly in Analyst Studio.
Does Analyst Studio time out long-running queries or Reports?
Analyst Studio cancels any incomplete queries or Report runs after a certain period of time to prevent long-running queries from degrading performance. Note that your database may be configured to time out queries sooner than the times listed below.
| Scenario | Time-out |
|---|---|
Manual query / report run |
12 hours |
Scheduled run (daily / weekly / monthly) |
12 hours |
Scheduled run (hourly) |
1 hour |
Scheduled run (every 30 minutes) |
30 minutes |
Scheduled run (every 15 minutes) |
15 minutes |
In what order are queries executed during a report and scheduled run?
Queries are initiated simultaneously and results are returned based on the processing time of your database. This allows for efficient and concurrent query processing, ensuring that your queries are executed as quickly as possible. By starting queries simultaneously, Analyst Studio maximizes the use of your database resources and minimizes the overall time it takes to retrieve results.