Advanced R customizations
Learn about R customizations.
Admins and users with the Has SpotIQ privilege can run an R script.
The R language is an open source programming language used for statistical computing. As such, knowledgable users can use R to perform sophisticated analysis in a ThoughtSpot environment.
This section explains the feature and how to use it. It is not meant as an R primer. To learn more about R and how to use it, visit the R Project for Statistical Computing.
Understand R script requirements in ThoughtSpot
ThoughtSpot provides R running as a service within a ThoughtSpot cluster. Permissions are restricted. This means the R script does not have permission to issue system commands.
The ThoughtSpot cluster has pre-installed the basic R packages. If your script requires a specific package, you must request your ThoughtSpot cluster admin to install the package on your behalf.
ThoughtSpot internally transforms and binds an R script prior to sending it to the cluster’s R service. The system expects each script to have a well-defined structure, following this format:
####R SCRIPT####
<Fill script body>
####COLUMN BINDINGS (ONE PER LINE)####
<Fill column bindings here>
The scripts contains the column bindings with the answer results appearing as parameters in the R script.
For each .param n in R your script, you must provide a corresponding binding.
The following pseudo code illustrates an R script in a form suitable for ThoughtSpot:
####R SCRIPT####
df <- data.frame(.param0,.param1, ...);
...
write.csv(..., file=#output_file#, ...);
Notice that .param0 refers to first column in column binding and .param1 refers to the second.
Should you need a third binding, you would use .param2 and so forth.
The output of the script is either PNG (images) or CSV (comma-separated values, such as a table).
This example script uses #output_csv# for an output in a CSV (tabular) format.
Use #output_png# for an output in PNG format.
Presently, error reporting is limited for R scripts in SpotIQ. You should validate your R script independent of your ThoughtSpot environment. After you are sure it is free of syntax or other errors, you can try the script in ThoughtSpot.
Try a Custom Analysis with R
This example illustrates how to run an R analysis on data that has a sales column and a zip code column.
-
Sign in to ThoughtSpot and go to the Search bar.
-
Use Choose Sources to locate a source with sales and zip code data. This example uses Sporting Goods Retail Worksheet data.
-
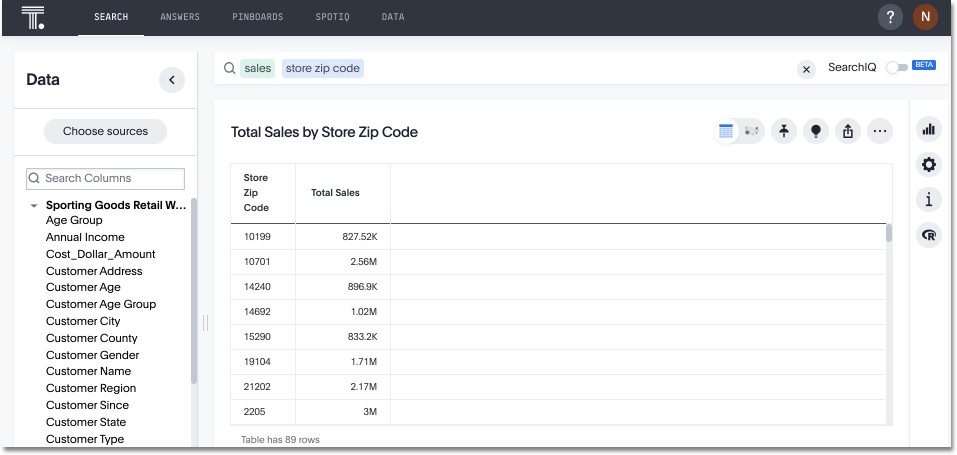
Enter
sales store zip codein the search bar.If your source contains the proper data, you should see something similar to the following:
-
Click the View R analysis icon
 .
. -
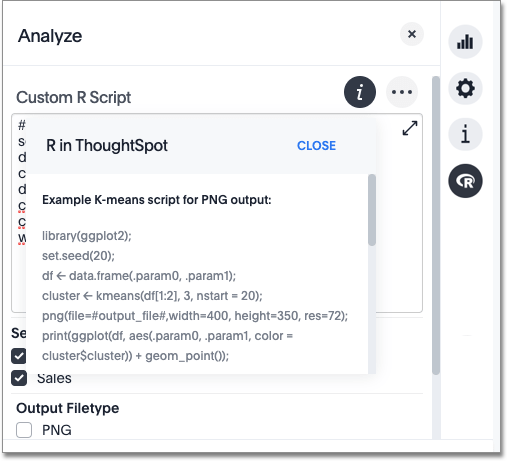
Enter this sample script in the field.
 ####R SCRIPT####
 library(ggplot2)
 set.seed(20)
 df <- data.frame(.param0, .param1)
 cluster <- kmeans(df[1:2], 3, nstart = 20)
 cluster$cluster <- as.factor(cluster$cluster)
 png(file=#output_file#,width=400,height=350,res=72)
 print(ggplot(df, aes(.param0, .param1, color = cluster$cluster)) + geom_point())
This script binds
.param0toSalesand.param1to theStore Zip Codecolumn.You can see from the script that the output should be PNG (
#output_png#). -
For Select column(s) for R analysis, make sure that both Sales and Store Zip Code columns are selected.
-
For Output Filetype, make sure PNG is selected as the output format.
-
Click Run Analysis.
SpotIQ runs your analysis in the background.
-
When the analysis is completed, you should see the results in PNG format similar to the following:
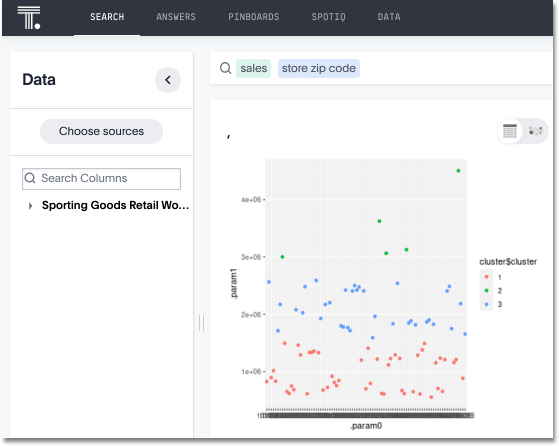
You can run another R script directly on this result to get CSV results. Try this on your own. Here is the script to give you CSV output:
###R SCRIPT####
set.seed(20);
df <- data.frame(.param0,.param1);
cluster <- kmeans(df[1:2], 3, nstart = 20);
df$Cluster <- as.factor(cluster$cluster);
colnames(df)[1] <- 'Sales';
colnames(df)[2] <- 'Zip Code';
write.csv(df, file=#output_file#, row.names=FALSE);