Heatmap charts
Heatmap charts are similar to treemap charts: they both use a similar system of color-coding to represent data values. However, the heatmap does not use size to measure data, and instead requires an additional attribute.
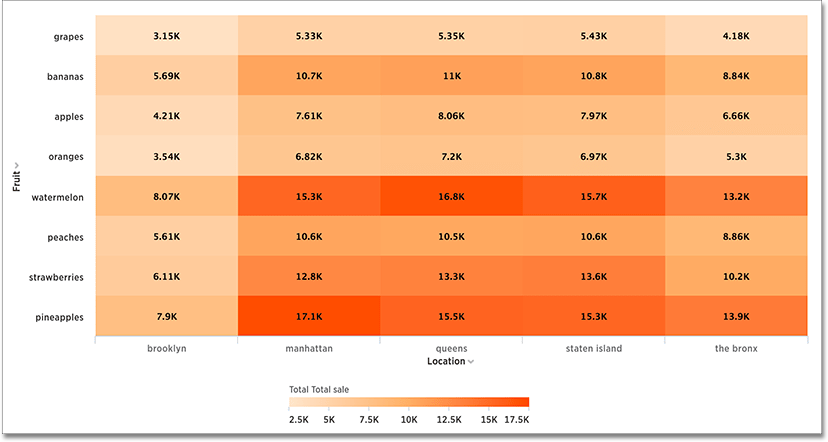
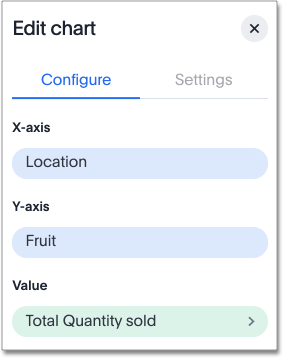
The value of each cell depends on the measure you choose under Edit chart configuration.
Was this page helpful?Give us feedback!


