Answer Explorer
Answer Explorer provides you with AI-guided exploration of Answers within Pinboards, so you can more easily find valuable and actionable information inside your data.
Answer Explorer, ThoughtSpot’s AI-guided exploration of Answers and headline metrics within Pinboards, provides you with valuable suggestions on how to explore and understand your data, based on two main criteria. The Answer Explorer AI considers both popularity and personalization. The feature suggests ways to answer questions that are relevant to many other users, and takes your own ThoughtSpot history into account. Answer Explorer helps you better understand your data and get to actionable insights faster with just a click.
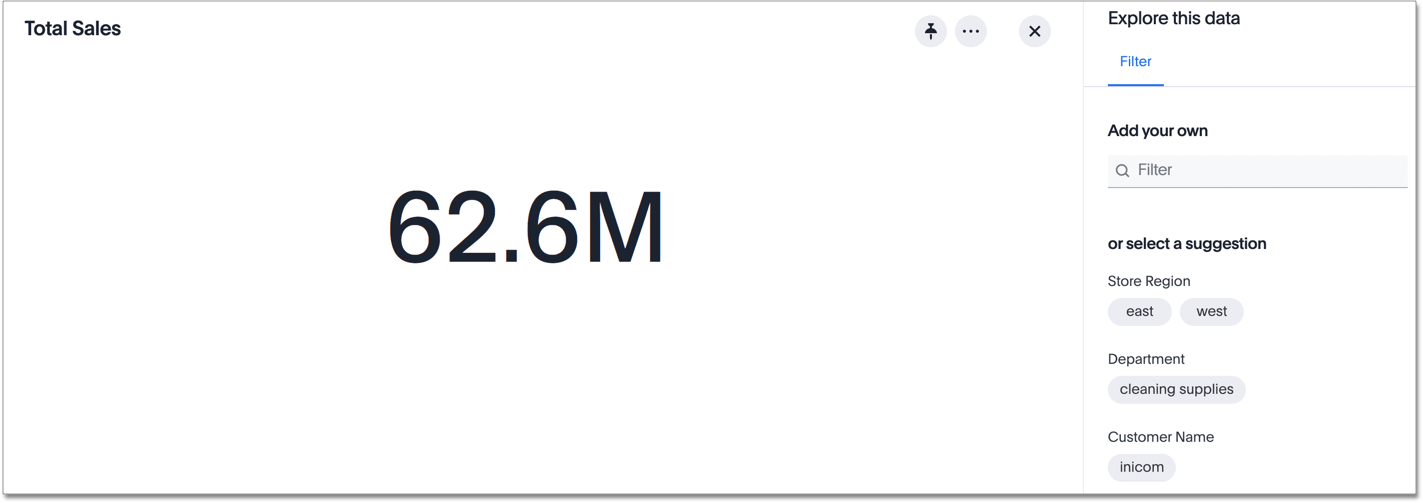
You can access Answer Explorer from any Answer or headline metric in a Pinboard. Click the Explore button that appears when you hover over any Answer or headline.
The Answer expands to fill your screen, and the Explore this data menu appears, on the Filters screen.
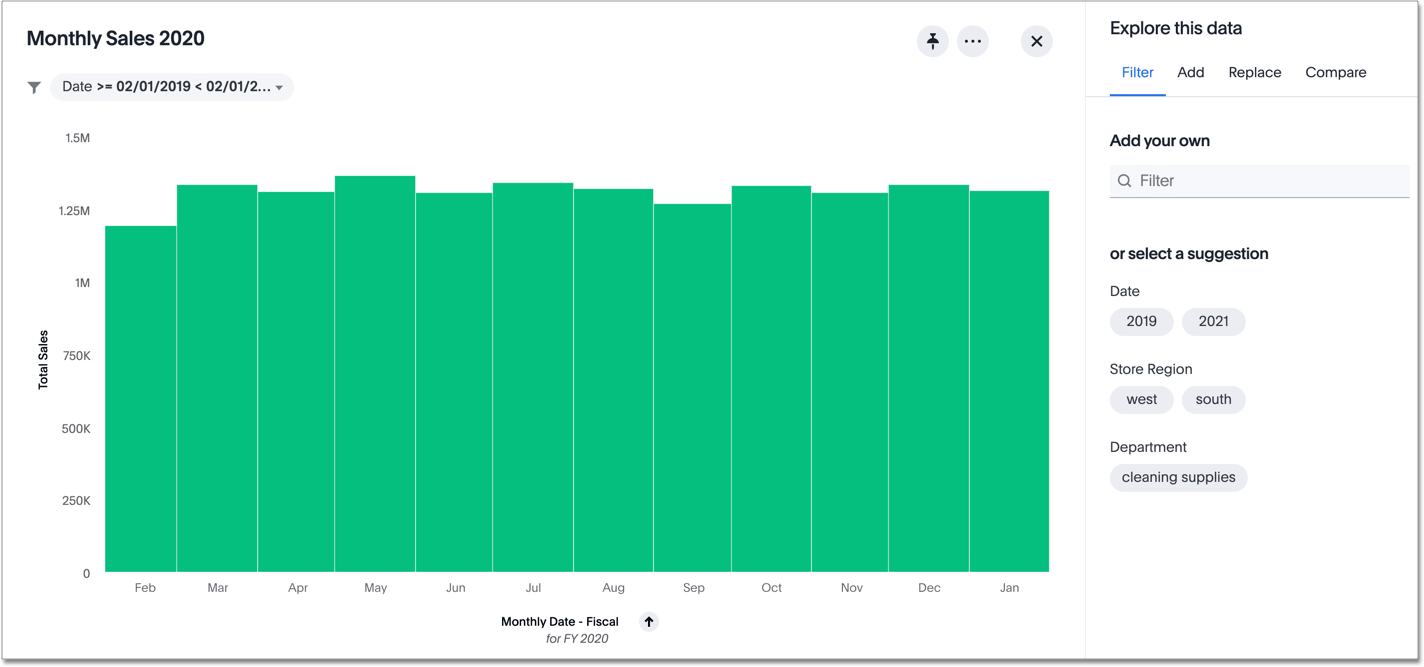
You can explore your data in several different ways, using filters, adding or replacing attributes or measures, or comparing attribute values.
Note that when you explore a headline, you can only use Answer Explorer to filter on it.
Answer Explorer’s AI updates its suggestions every time you add something new to your visualization. If you add a suggested filter, Answer Explorer then suggests new filters, comparisons, and columns to add or replace, based on that new filter in your chart. For example, in a retail data set, you might choose to add a filter for the west region. Answer Explorer might then suggest you add your data’s store state column, since you are interested in how your stores perform based on location. In this way, Answer Explorer’s suggestions become more relevant for you as you continue to use the feature.
After you make a change to your Answer, you may want to go back to an earlier version of your Answer.
You can click the Back icon ![]() to go back one step, or the Reset icon
to go back one step, or the Reset icon ![]() to go back to the original answer.
to go back to the original answer.
Filters
Use Filters to narrow down your search result to only include the data you want to see. Answer Explorer uses sophisticated technology to show only the most relevant suggestions. Click on a suggested filter to add it to your visualization.
| In Answer Explorer, you can only filter on attribute columns, not measures. |
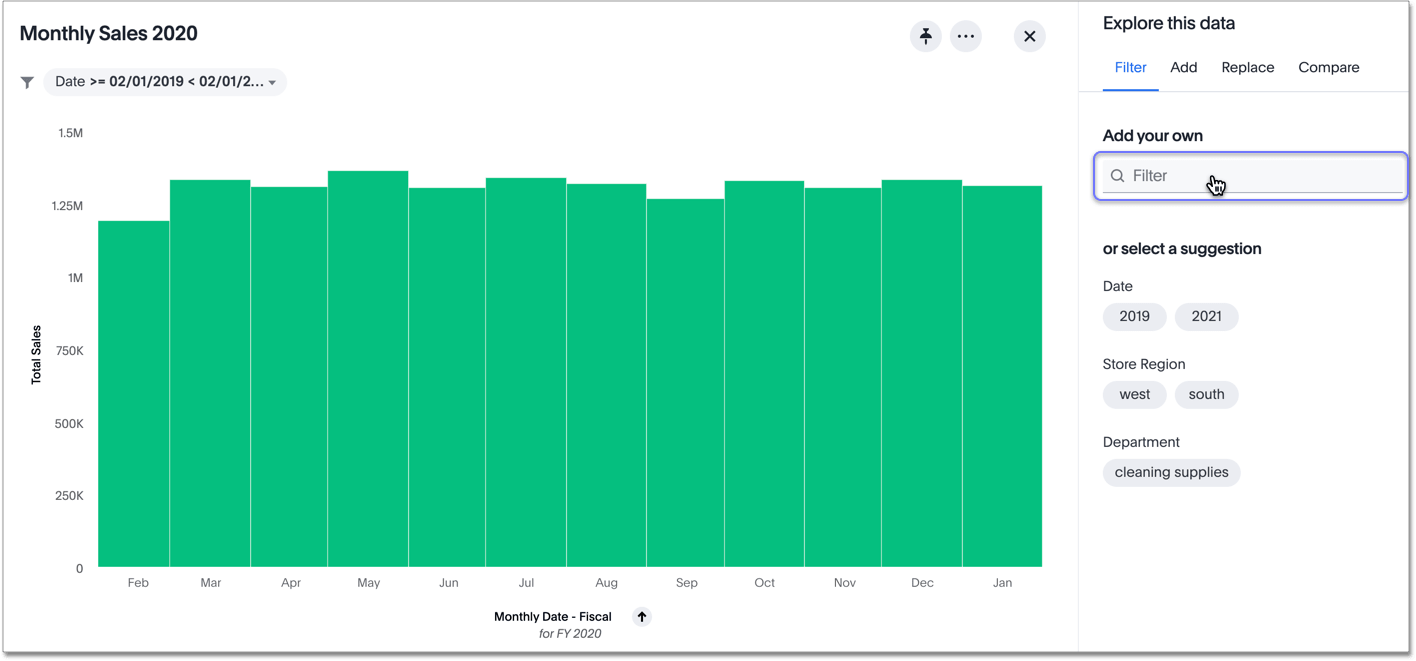
Add your own filters
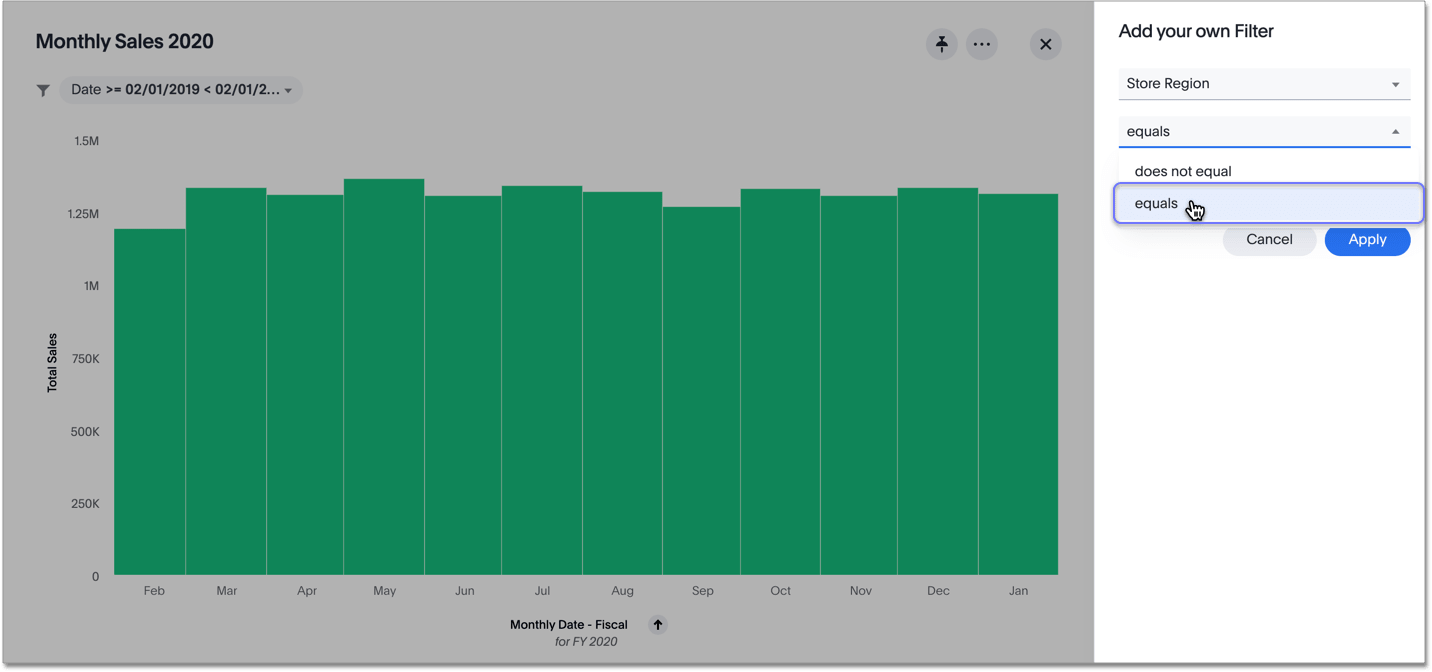
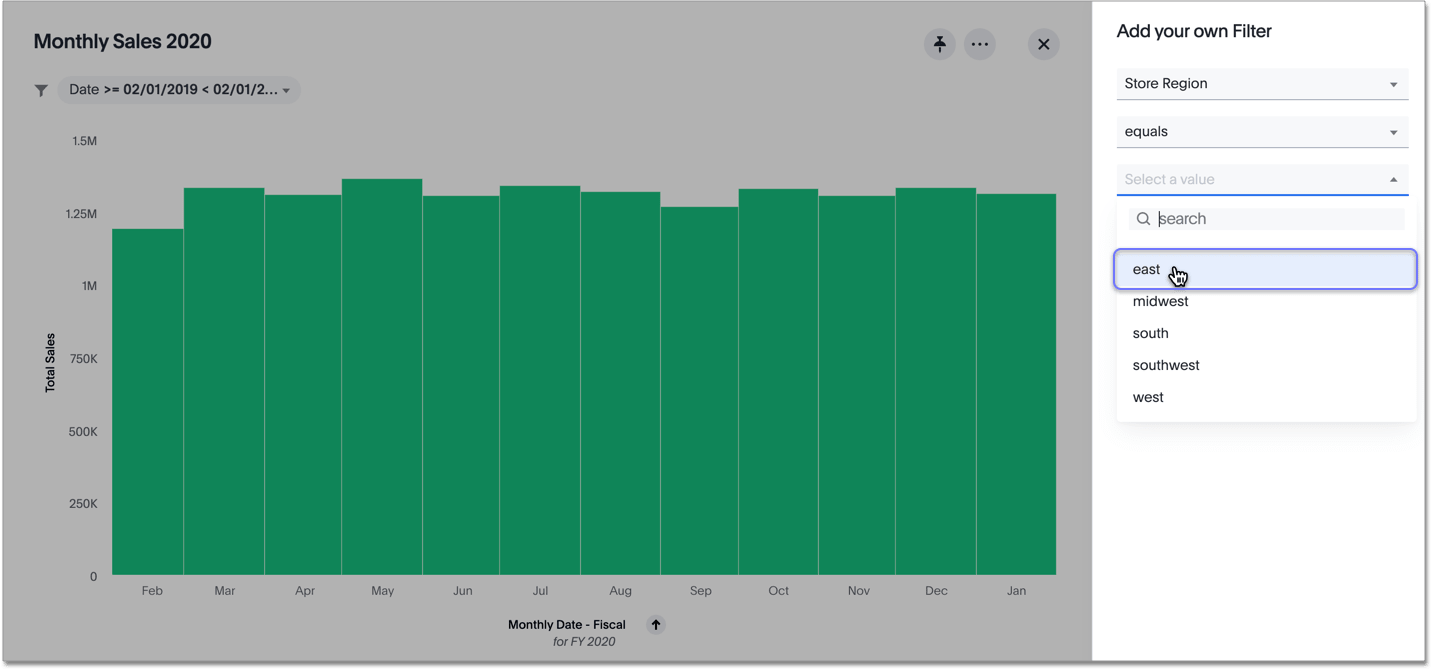
If you want to filter on a column value that Answer Explorer did not suggest, you can add your own filter, using the Filters search bar.
-
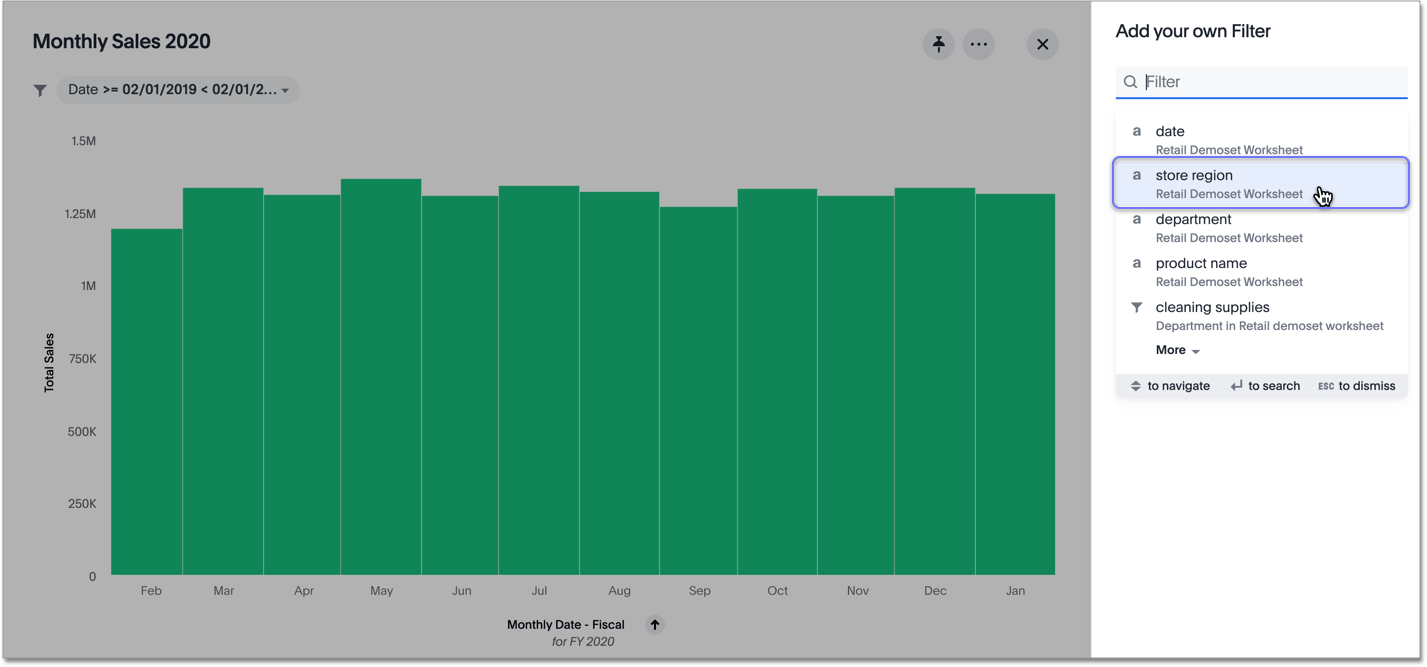
Click on the search bar under Add your own.
-
Choose an attribute column to filter on. For example, if you are a store manager for the east region, you may want to see monthly sales specific to the east region. You would choose to filter on the store region column.
-
Choose the filter operator: either equals or does not equal.
-
Choose the column value you would like to filter on.
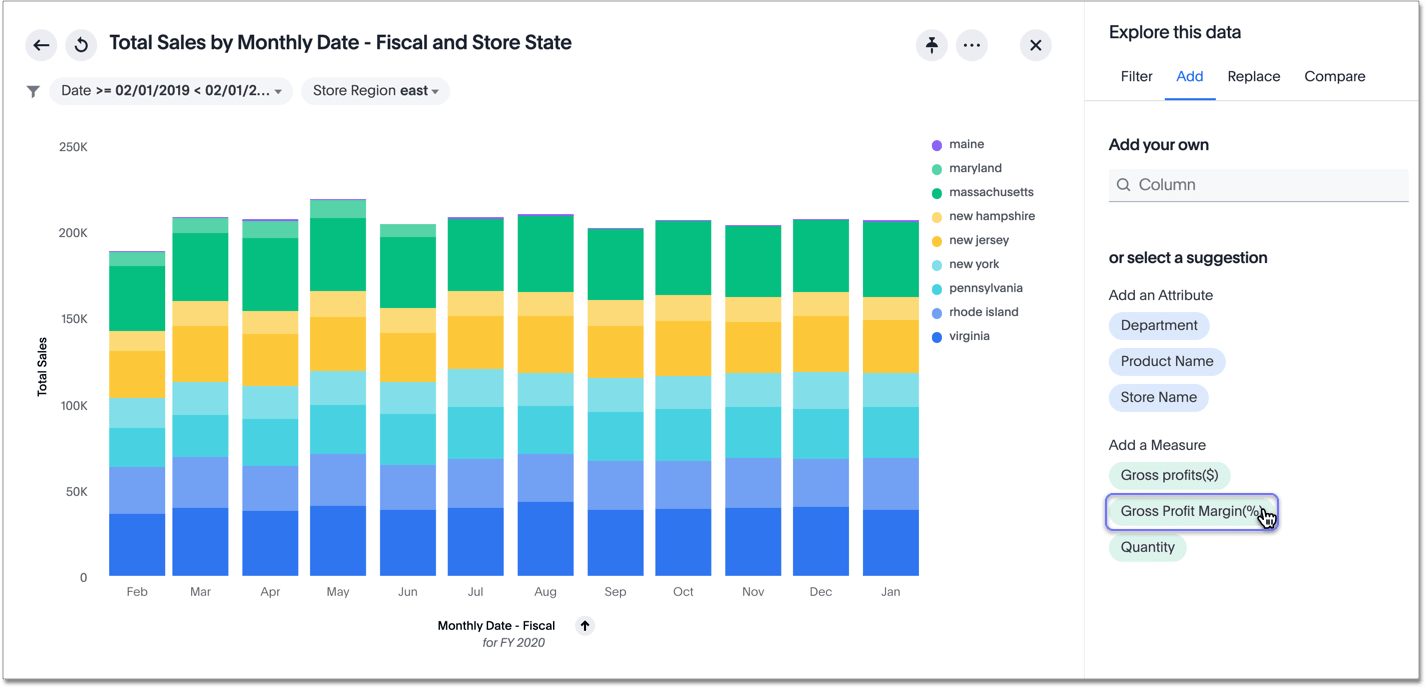
Add attributes or measures
Under the add tab, add attributes or measures to visualize your data with more detail. For example, add Store State to see which states have the best sales. Add gross profit margin to view both sales and gross profit margin by month.
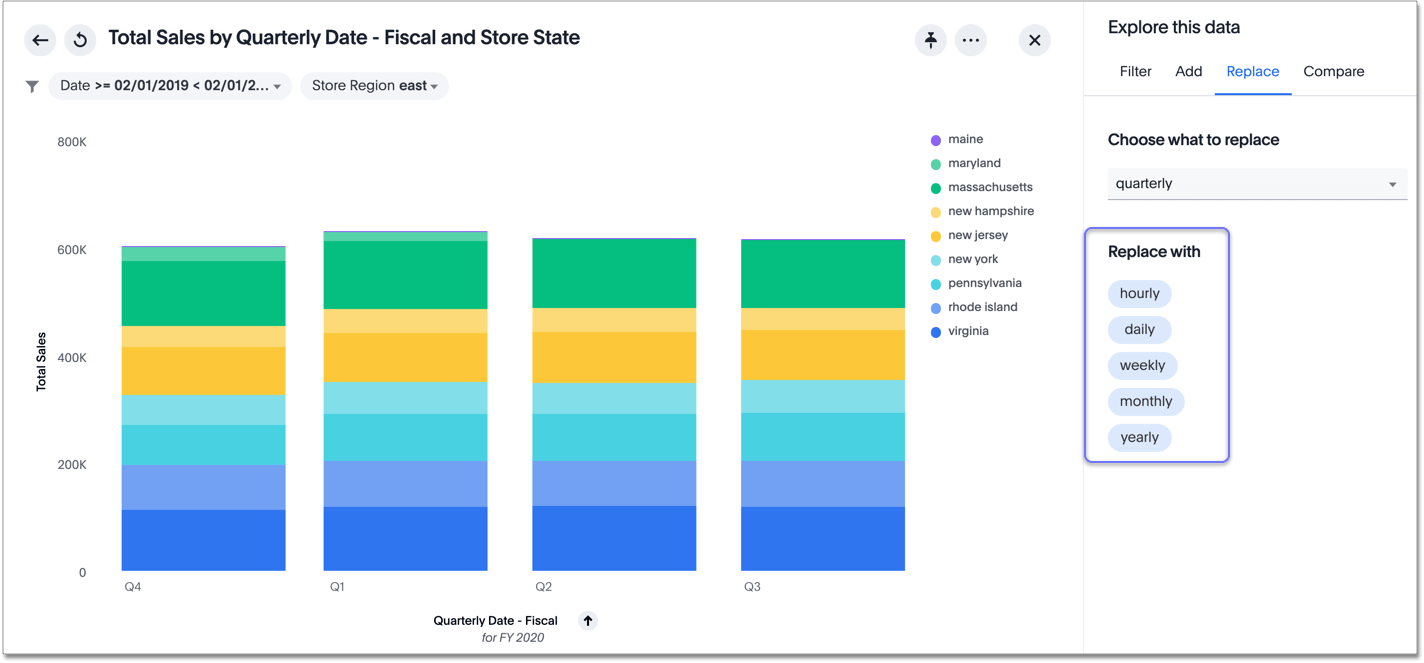
Replace attributes or measures
Under the replace tab, replace one attribute or measure with another. For example, if your Answer has a time attribute, you can easily change from monthly to quarterly, and so on.
Choose your own attributes or measures to replace
If you want to replace an attribute or measure that Answer Explorer did not suggest, you can choose your own, using the Replace column search bar.
-
Click on the search bar under Choose what to replace.
-
Choose an attribute or measure in your visualization to replace.
-
Click on the Replace with your own search bar that appears.
-
Choose an attribute or measure to add to your visualization.
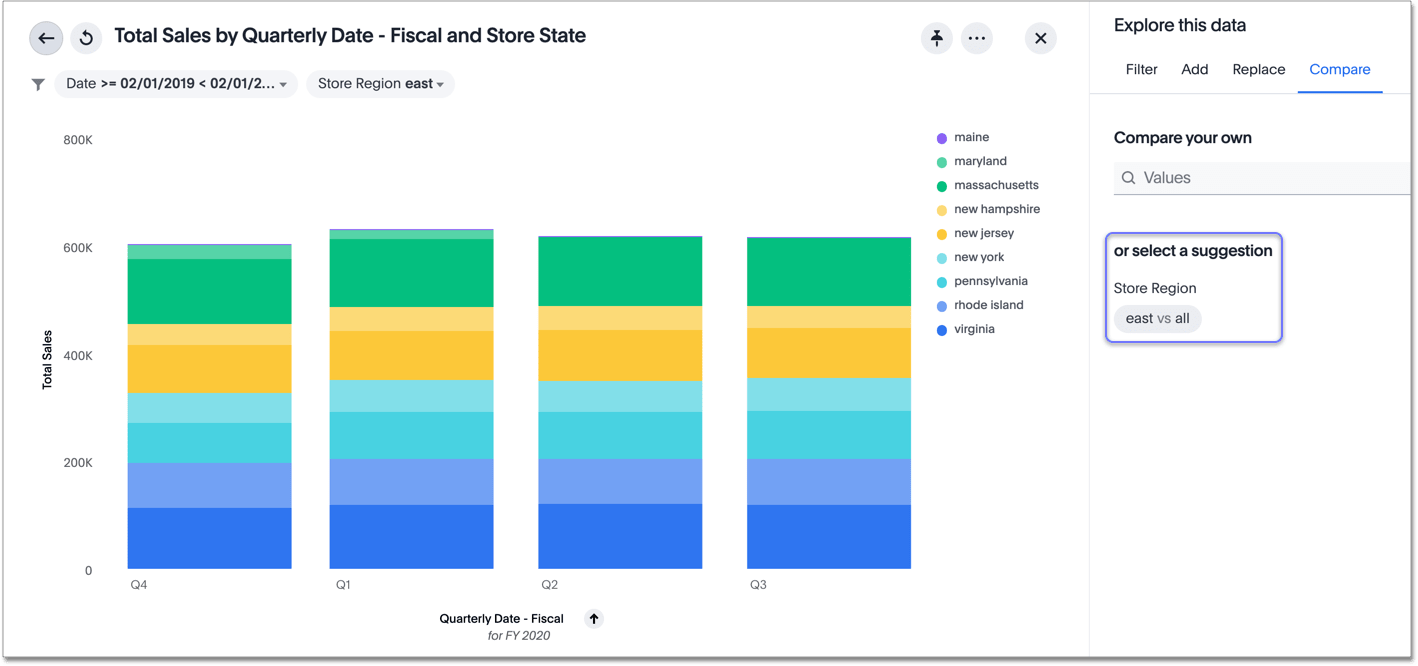
Compare attribute values
Under the compare tab, you can easily perform a versus analysis. For example, Answer Explorer might suggest you compare your best- and worst-performing products, or one store region to another.
Choose your own values to compare
If you want to compare values that Answer Explorer did not suggest, you can choose your own, using the comparisons search bar.
-
Click on the search bar under Compare your own.
-
Choose an attribute column whose values you would like to compare. For example, choose department if you would like to compare your bakery and produce departments.
-
Select the column values you would like to compare.
Drill down with Answer Explorer
You can Drill down from within Answer Explorer.
When you Drill down in Answer Explorer, you have the option of going back one step at a time, using the Back icon ![]() .
You cannot go back one step at a time if you Drill down on an Answer in a Pinboard, without using Answer Explorer.
.
You cannot go back one step at a time if you Drill down on an Answer in a Pinboard, without using Answer Explorer.
See Drill down.
Save your new answer
When you find a valuable insight using Answer Explorer, you may want to save that Answer as it appears, instead of trying to recreate it in the Search bar.
-
Click the More menu icon
 .
. -
Select copy and edit.
-
Save your new Answer within ThoughtSpot and continue working with it.
-
Alternatively, select Download to download an image of your current visualization.
You can also pin the current Answer to any Pinboard you have edit access to.
Click the pin icon ![]() and select a Pinboard.
and select a Pinboard.
Otherwise, the Answer returns to its original state when you exit the Explore menu by clicking the X icon.


