Time series analysis
You can compare across time periods without using a formula.
A time series is a set of data points ordered by time. For example, in such a data set, a sale in January 2020 comes before a sale in February 2020. You can use ThoughtSpot’s time series analysis feature to search for answers about series data.
You might use this feature to compare a time period across other time periods. For example, you might look at sales for each month across several years. You may also want to calculate an aspect such as growth over the same time period across other periods. You can also do relative analysis, such as sales for the last 3 months of each year across several years.
You can use one or more of the following period keywords to create this type of analysis.
Period keywords
- day
-
- Example
-
orders by day
- day of month
-
- Example
-
sales day of month by month
- day of quarter
-
- Example
-
deals day of quarter by year
- day of week
-
- Example
-
customers by week day of week
- day of year
-
- Example
-
ad clicks day of year by year
- hour
-
- Example
-
visitors by hour weekly
- month of quarter
-
- Example
-
purchases month of quarter by year
- quarter
-
- Example
-
purchases by quarter
- quarter of year
-
- Example
-
opportunities quarter of year last 4 years yearly
- week of month
-
- Example
-
product shipments week of month yearly
ThoughtSpot uses ISO week format for the week of [month | quarter | year]keywords, which means that the last few days of a quarter may sometimes show as the first few days of the next quarter, based on the ISO week date system.
- week of quarter
-
- Example
-
revenue week of quarter
ThoughtSpot uses ISO week format for the week of [month | quarter | year]keywords, which means that the last few days of a quarter may sometimes show as the first few days of the next quarter, based on the ISO week date system.
- week of year
-
- Example
-
new products week of year last 3 years yearly
ThoughtSpot uses ISO week format for the week of [month | quarter | year]keywords, which means that the last few days of a quarter may sometimes show as the first few days of the next quarter, based on the ISO week date system.
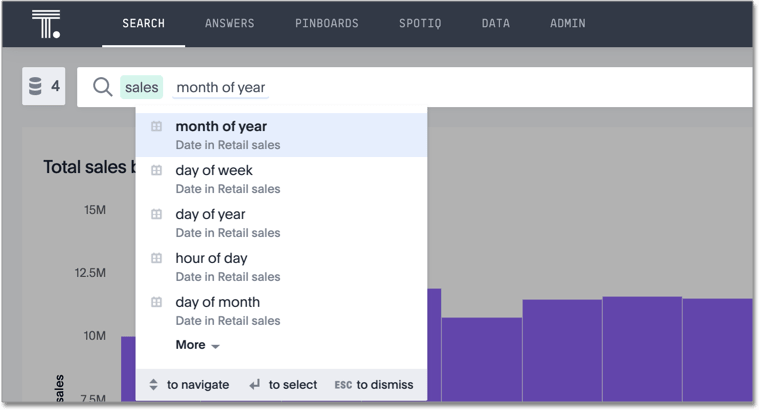
All of these keywords sort the data using datetime semantics, that is, chronologically in a time sequence. When you type one of these keywords into the search bar, ThoughtSpot asks you to pick which data source to apply it to. By default, the Search bar suggests these keywords less frequently than others.
You can use these new keywords in combination with the existing data keywords which are:
-
Detailed -
Hourly -
Daily -
Weekly -
Monthly -
Quarterly -
Yearly
Examples of time series analysis
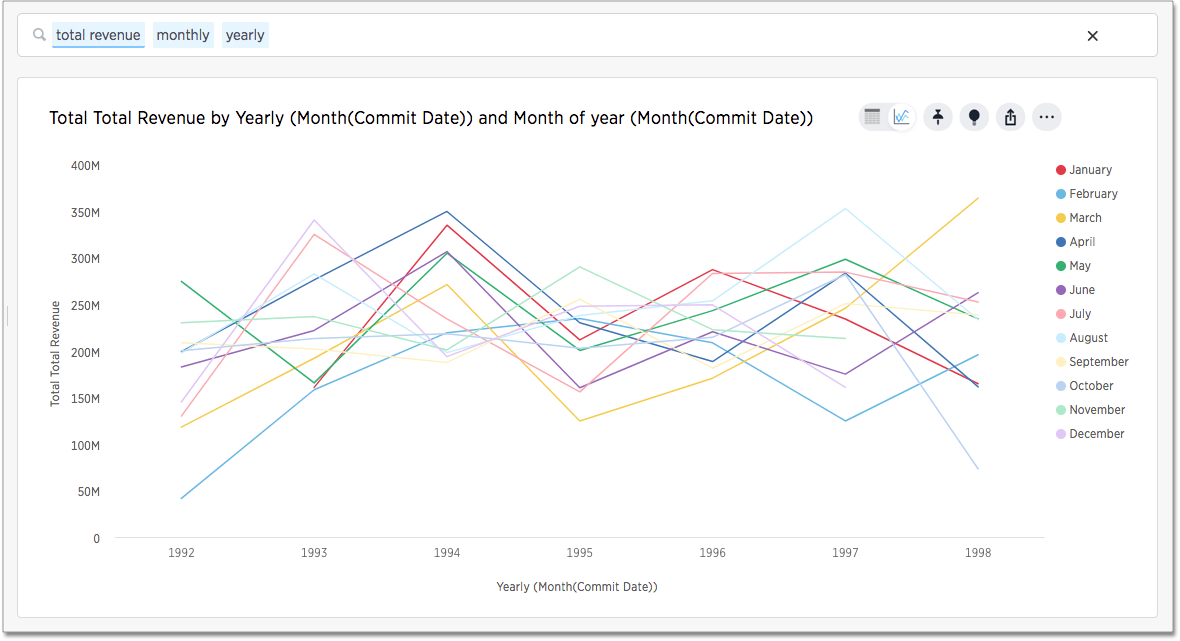
Typically, when you search for answers about series data, the visualizations that answer your questions are line charts. These charts frequently but not always include a stack to indicate a period.
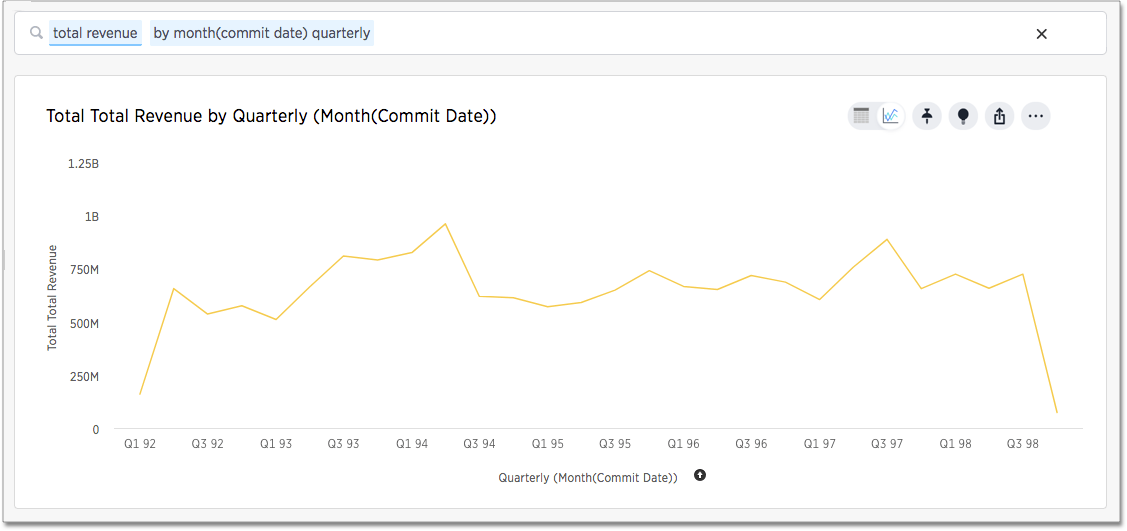
When you search for an aspect of data of time series, a typical response is a line chart showing the aspect as it rises and falls over time.
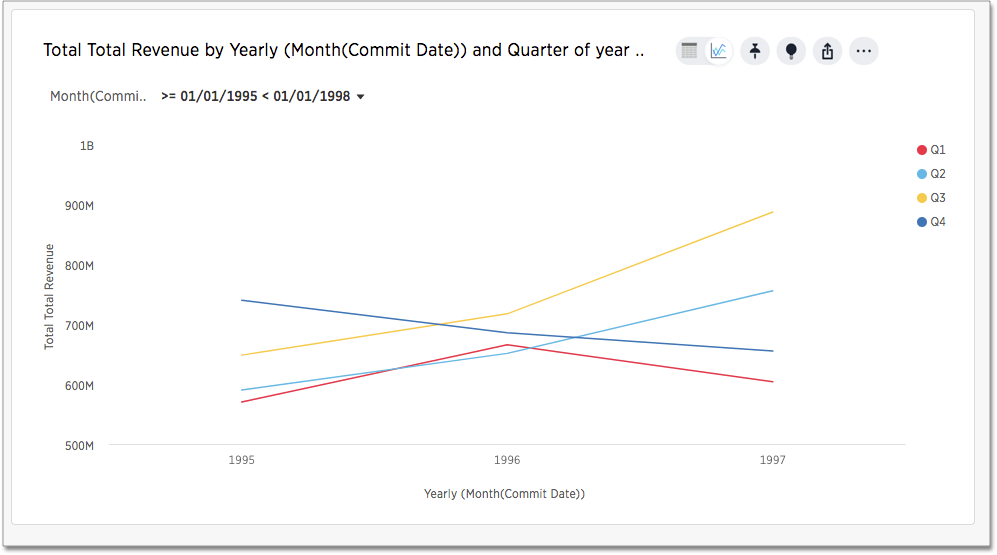
You can also add a relative date filter. For example:
total revenue quarterly yearly by year month >= 01/01/1995
month before 01/01/1998
This type of query also yields a stacked line chart:
The child date time attribute is on the X-axis and the parent in the legend.
For example, if you search revenue month yearly the child, monthly, appears on the x-axis and the parent, yearly, in the legend.
Granularity for date filters
You can refine a simple date filters by adding hierarchical date filter to your query. The ability to specify two bucket granularities such as "hour of day" or "week of year" are two examples. The syntax of this type of query is
small_bucket of big_bucket [INTEGER_CONDITION]
The INTEGER_CONDITION is optional but it must be an integer.
For example, this query is valid:
revenue by day of week <= 2
This query is invalid:
revenue by day of week = Tuesday
You can specify one or more granular filters.
These tips and gotchas apply to time granularity:
-
The system-defined fiscal rules are respected. This means, for example, if the fiscal year begins in February,
month of year = 2matches dates in March. -
Fiscal shorthands such as
Q1,Q2and so on are not supported, soday of week = d1is not valid. -
INTEGER_CONDITIONwith=or!=accept a list of filter values, so,day of week = 1 2 3is valid. -
INTEGER_CONDITIONwith=or!=require legal values, soday of week >accepts any integer on the right-hand side whileday of week =requires a value in the legal1-7range. -
Simple date filters allow you to use edit the filter through the answer to refine your search, adding a hierarchical date filter in the search bar disables this ability.
Create a max(date) field and use it to filter
If you have a date field in your data set and want to return the most recent set of data based on a specific date, do the following:
-
Create a formula called
Max Date.For example:
date = group_max ( date_to_filter_by )
-
In the search bar, filter your dates by this formula.
For example:
max date = true
This returns only those fields that pass the filter.


