Search using growth over time
You can show growth over time by using the growth of keyword in your search.
The growth of keyword compares the data from different date periods, and returns a percentage of growth.
Enter growth of at the beginning of your query.
You can only use the growth of keyword once in your query.
Growth of measure by year
To search using growth over time:
-
Type
growth ofinto the search bar, and choose a measure you’re interested in seeing the growth of.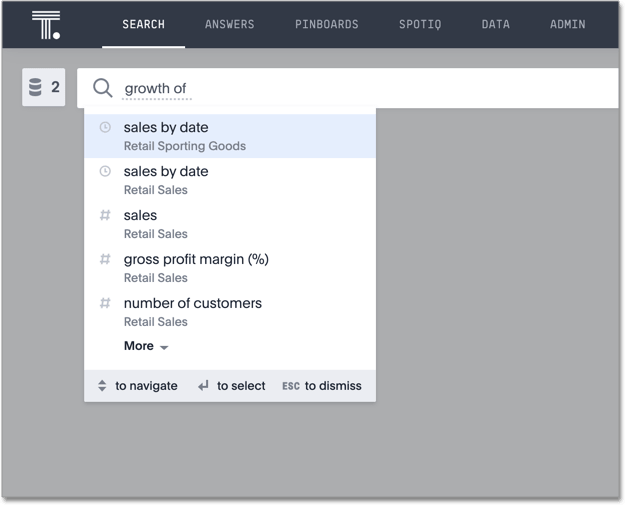
You see a list of suggestions to choose from, based on your data sources. You can also type a different column name containing numeric data to compare.
-
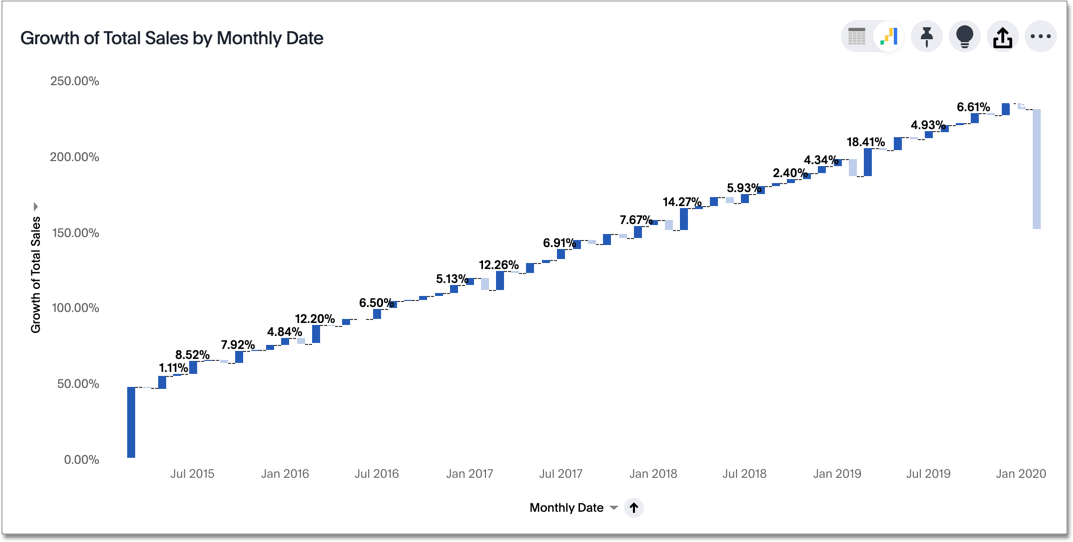
Type
by, followed by a date column name.ThoughtSpot calculates growth of a measure as a positive or negative percentage, for each period relative to the last period in the series. The difference between the value of a measure at two dates is divided by the value of the earlier date, and then multiplied by 100 to get a percentage.
A line chart is a good way to display your data, but the waterfall chart is especially effective to show growth.
-
You can also do year-over-year analysis, which compares each time period to the corresponding time period in the prior year.
This type of growth analysis is more common in retail and other seasonal businesses. To do this, type
monthly year-over-yearafter yourgrowth ofphrase in the search bar.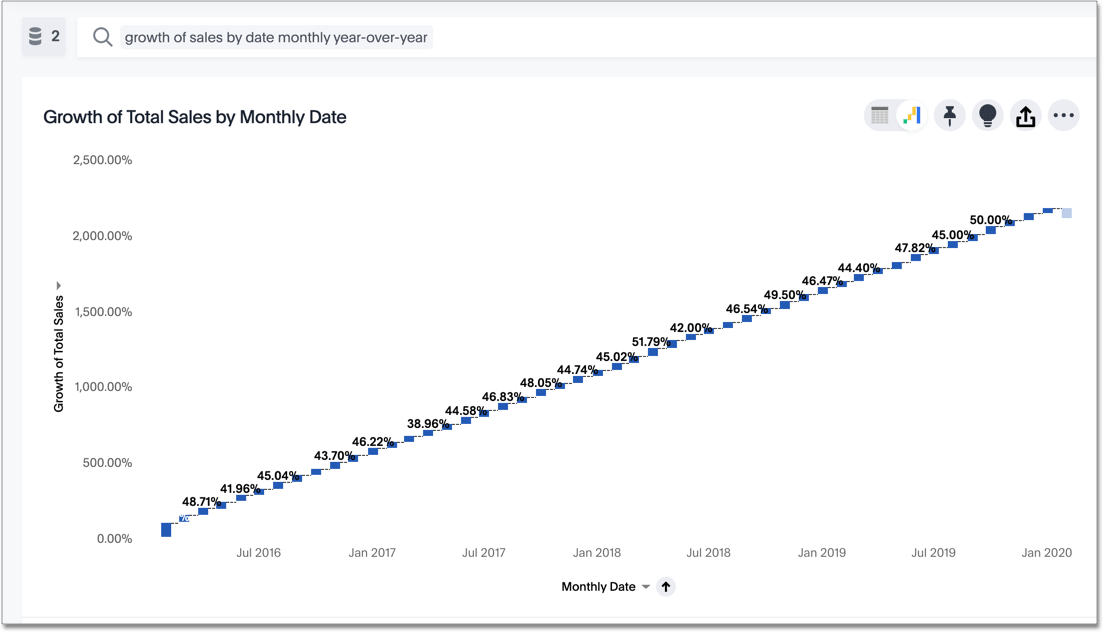
The
year-over-yearkeyword compares data between the same time period from different years. For example, it will allow you to compare sales from June of this year to the sales from June of last year. Note that for the first year, values are labeled as "{Blank}" in the Data View since there are no previous data to compare them to. -
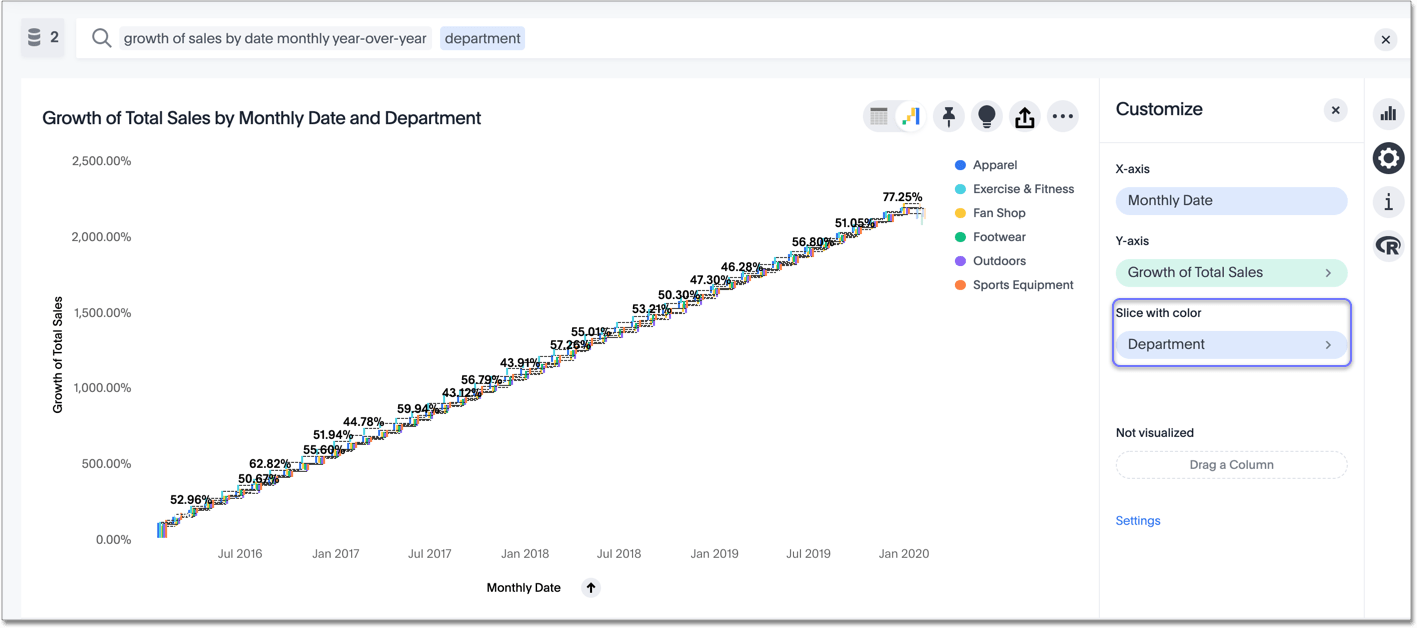
Add an attribute to your search to see the breakdown of how each grouping of the attribute contributed to the overall growth of your measure.
Click Configure Chart and drag your attribute to Slice with color.
Display periods (daily) over time (year-over-year)
The growth of keyword also supports more hierarchical date buckets and period calculations.
The growth query syntax is as follows:
growth of <measure_column> by <date_column> <bucket> <period-over-period>
This table shows the possible buckets and the period-over keywords you can combine:
|
|
|
|
|
|
|
|
|
|
|
|
|
||
|
|
|||
|
||||
|
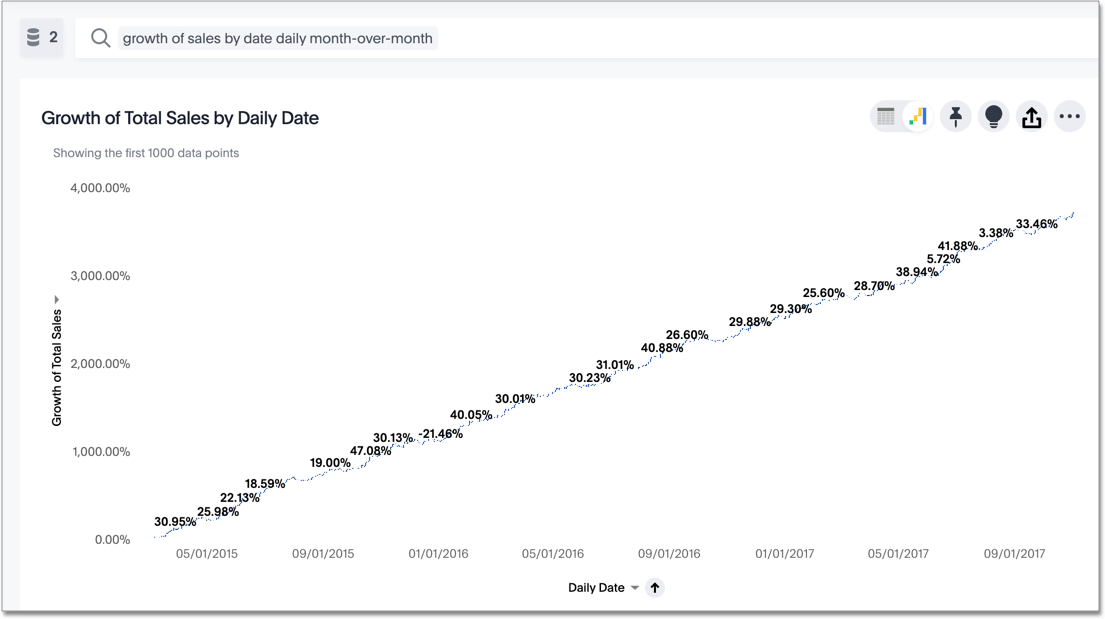
For example, see the query growth of sales by date daily month-over-month:
Related information


