R in ThoughtSpot
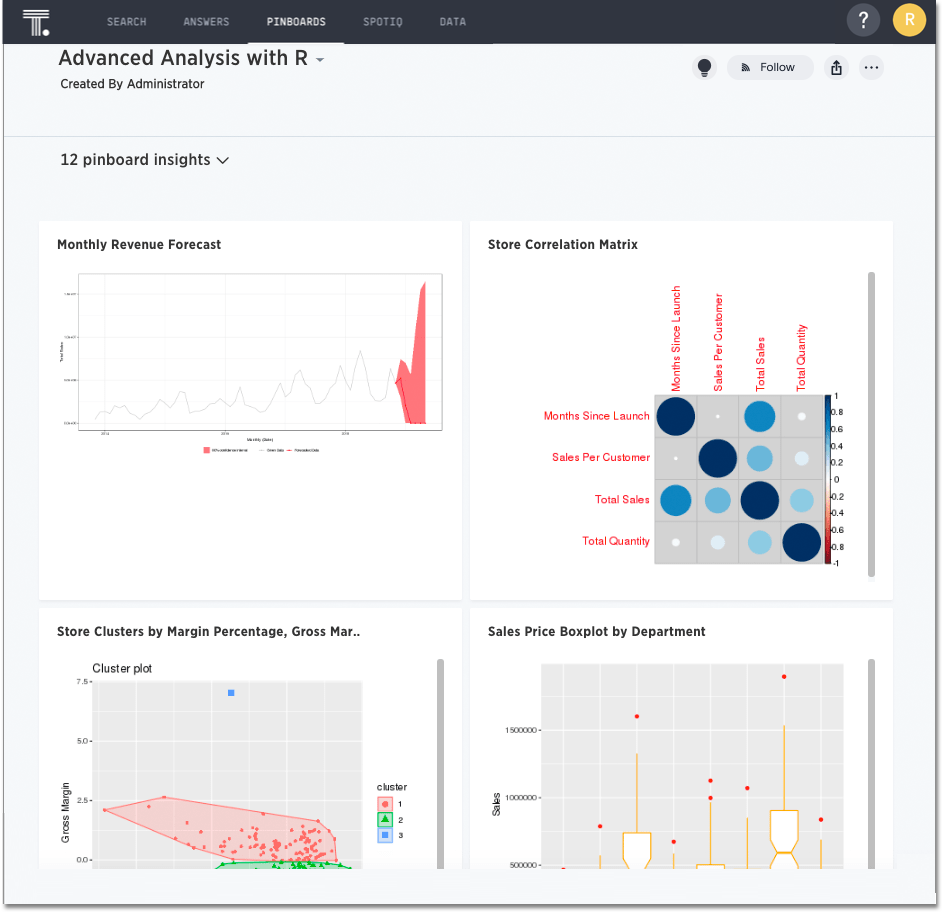
Analyze your data with R scripts that ship with ThoughtSpot, and build visualizations and Pinboards based on the analytical insights you obtained. You can also create custom R scripts, and share them with your team.
R is a popular open source programming language for statistical computing, machine learning, and AI. ThoughtSpot makes R analysis available as a fully integrated feature.
| We support R Deprecated 8.4.0.sw [LA] only in Falcon deployments (data imported into ThoughtSpot), and R integration is disabled by default. It is not available when creating connections and linking to external databases in real time. |
Using R in ThoughtSpot
Users with the Can invoke custom R analysis privilege can run R scripts directly on search results.
Analysts and data scientists who are proficient in R can create and share custom scripts.
Users can leverage custom scripts and ThoughtSpot provided scripts, run pre-built R scripts on top of their search results, and share R visualizations as answers and pinboards.
This article explains how to use R in ThoughtSpot both from an end user and scripting perspective, but is not meant as an R primer.
Understand R script requirements in ThoughtSpot
ThoughtSpot provides R as a service within a ThoughtSpot cluster. Permissions are restricted. This means the R script does not have permission to issue system commands.
The ThoughtSpot cluster has pre-installed the basic R packages. If your script requires a specific package, you must contact your ThoughtSpot cluster administrator.
ThoughtSpot internally transforms and binds an R script prior to sending it to the cluster’s R service. The system expects each script to have a well-defined structure, following this format:
####R SCRIPT####
<Fill script body>
####COLUMN BINDINGS (ONE PER LINE)####
<Fill column bindings here>
The scripts contain the column bindings, and the answer results appear as parameters in the R script.
For each .param n in R your script, you must provide a corresponding binding.
The following example illustrates an R script in a form suitable for ThoughtSpot:
####R SCRIPT####
df <- data.frame(.param0,.param1, ...);
...
write.csv(..., file=#output_file#, ...);
Notice that .param0 refers to the first column in column binding and .param1 refers to the second.
Should you need a third binding, you would use .param2 and so forth.
The output of the script is either PNG (images) or CSV (comma-separated values, such as a table).
This example script uses #output_csv# for an output in a CSV (tabular) format.
Use #output_png# for an output in PNG format.
Presently, error reporting for R scripts in SpotIQ is limited. You must validate your R script independent of your ThoughtSpot environment. After you are sure it is free of errors, you can try the script in ThoughtSpot.
How to access R scripts
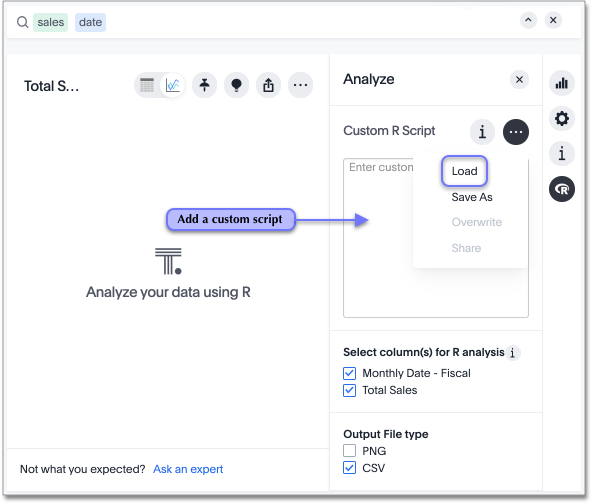
Users with R script privileges can click the R icon ![]() on the toolbar for any search result (answer).
on the toolbar for any search result (answer).
From here, you have options to write a custom script, or load a pre-built or ThoughtSpot provided script.
Run pre-built R scripts
You don’t have to have a background in statistics or be an R programmer to run R analyses in ThoughtSpot. You can use ThoughtSpot-provided scripts and share the R visualizations with others.
For more on how to run provided scripts, refer to Run pre-built R scripts on answers.
Write your own R scripts in ThoughtSpot
If you know R, you can write your own custom scripts, share them as templates, test and run them on your data in ThoughtSpot, and build up a shared library of R analyses, scripts, visualizations, and pinboards.
Start with the topic on how to Create and share R scripts to learn more about writing R scripts in ThoughtSpot, including a few particulars on syntax and column bindings.
To learn more about R programming in general, a good place to start is R Project for Statistical Computing. Also, Antony Chen’s blog post on Using R Analysis in ThoughtSpot for Time Series Forecasting is a nice introduction to writing R scripts in ThoughtSpot.