Moving functions
Moving formulas can be used to smooth out any irregularities in your data to easily recognize trends.
The larger intervals smooth out a larger number of peaks and troughs in your data. When the intervals are smaller, the moving formulas are closer to the actual data points.
Syntax
Each of the moving formulas accepts a measure, two integers to define the window or interval, and one or more optional attributes.
formula (
  measure,windowStart,windowFinish,
  [attribute1,attribute2,...])
Moving formulas require only the measure and integer values. However, if you do not specify the attributes, the function reverts to a non-moving measure; in other words, a moving_sum() functions as a sum(). When you specify both required and optional values, the formula returns the aggregate of the measure over the provided attributes for the defined window.
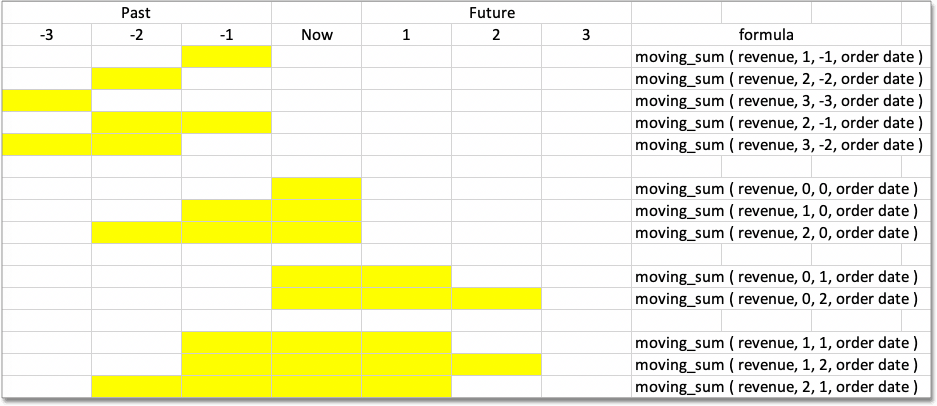
ThoughtSpot determines the window through the following formula:
current row - integer1, current row + integer2Therefore, a window of (1,1) contains 3 rows in total: one row before the current row, the current row, and one row after the current row.
You can use moving functions to emulate "lag", by specifying negative values for the window values. For example, a window of (1,-1) contains only 1 row, the one that precedes the current row. In other words, the interval is (current row - 1) through (current row -1).
| When the windowing attribute is character-based, ThoughtSpot orders values alphanumerically to determine the row order for the window calculation. |
For more information on how the time windows work, see this chart:
ThoughtSpot has the following moving formulas:
- moving_average
-
Returns the average of the measure over the given window.
- Example:
-
moving_average (revenue, 2, 1, customer region)
- moving_max
-
Returns the maximum of the measure over the given window.
- Example:
-
moving_max (complaints, 1, 2, store name)
- moving_min
-
Returns the minimum of the measure over the given window.
- Example:
-
moving_min (defects, 3, 1, product)
- moving_sum
-
Returns the sum of the measure over the given window.
- Example:
-
moving_sum (revenue, 1, 1, order date)
Calculate a moving average
This example demonstrates using the moving_average formula.
To use the moving function in a search:
-
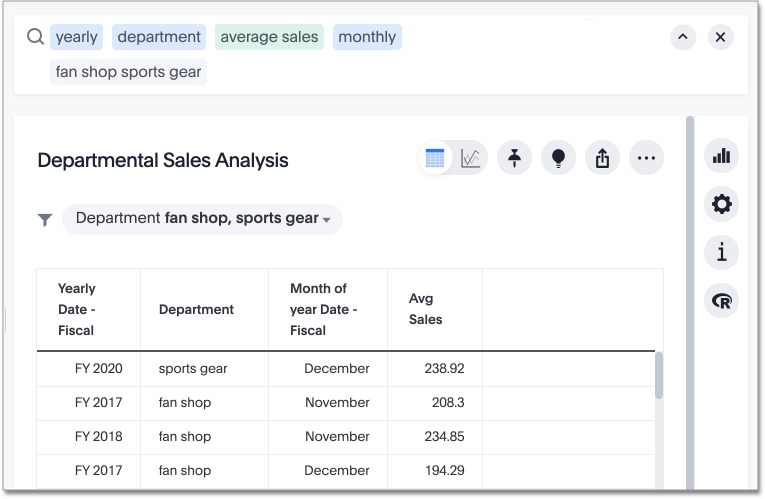
Start a new search.
-
In the upper-right side of the table, click the more options menu icon
 and select Add formula.
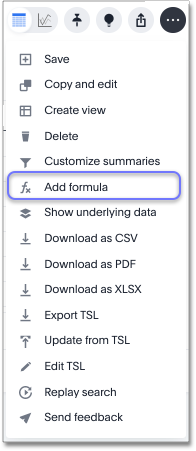
-
Enter the
moving_averageformula, specifying a measure, the window, and one or more attributes.The example returns the average of revenue, within the commit date window size of 3. The window includes the previous, current, and next rows. ThoughtSpot uses the attributes are the ordering columns to compute the moving average. The window is
(current - Num1…Current + Num2)with both end points being included in the window. For example, “1,1” has a window size of 3. To see periods in the past, use a negative number for the second endpoint, as in the example “moving_average(sales, 1, -1, date)”.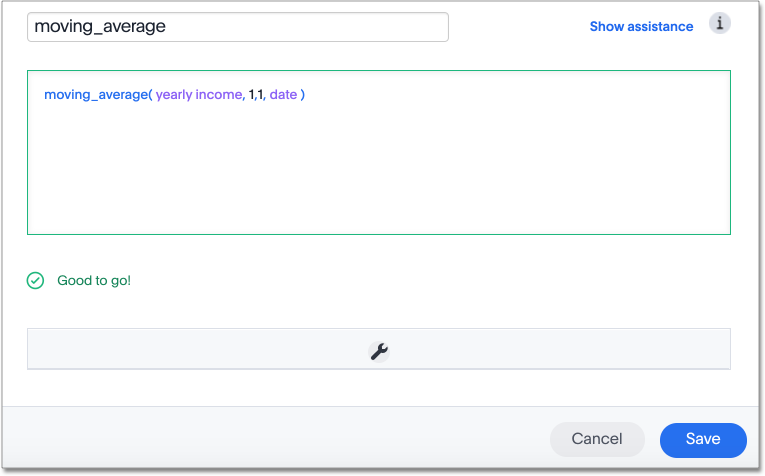
-
Name the formula by entering a title in the top field, and then click Save.
The formula will appear in the search bar and in the table as its own column.
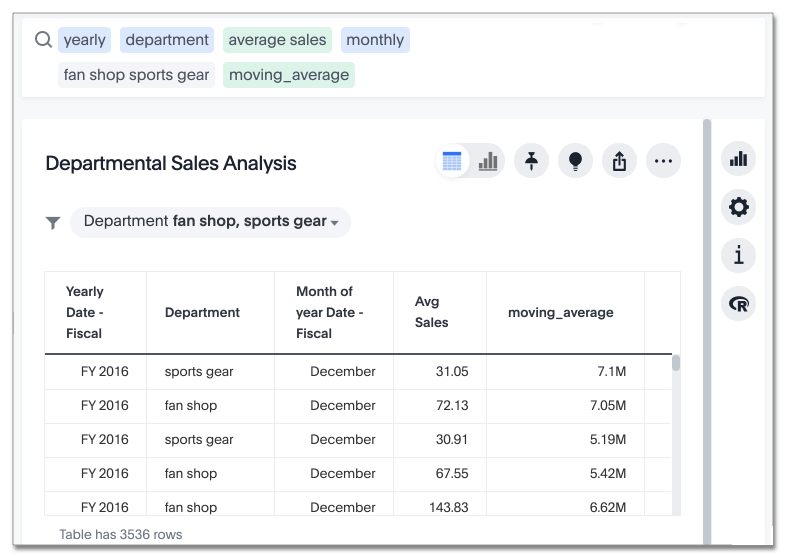
A box that displays the moving average within the entire table appear at the bottom of the chart.
-
To use a different aggregation type, click the current aggregation type at the bottom of the box and select another type.
Calculate a moving sum of a unique count
ThoughtSpot doesn’t have a purpose-built function for calculating a moving sum, or other moving formula, for a unique count. However, for many use cases, you can use a group_aggregate to facilitate this type of count. Adding a group_aggregate to your formula allows you to pass the aggregate function (in this case, unique count) in the windowing function (in this case, moving_sum).
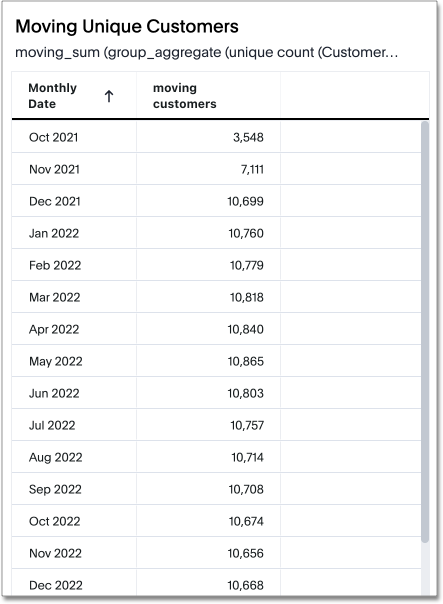
See the following example for the general formula for a moving sum of a unique count. In this example, we calculate the moving sum of unique customer names, using monthly date as our aggregation bucket.
moving_sum (group_aggregate (unique count (Customer Name ),query_groups (),query_filters ()),2,0,start_of_month (Date ))The result looks something like this:
You can use this syntax on any moving formula: average, maximum, minimum, and sum.
| This syntax produces a unique count for each individual result, such as Oct 2021. However, it doesn’t produce a unique count across results. If a customer name appears in both October 2021 and November 2021, for example, that customer would be counted in both those months. |


