Add a filter to a chart
You can add a simple filter from a chart axis while viewing your answer as a chart.
You can filter a chart in two ways:
-
Click the legend labels to toggle the values on or off.
-
Follow the steps shown here to filter on the axis values.
To add a filter from the chart axes:
-
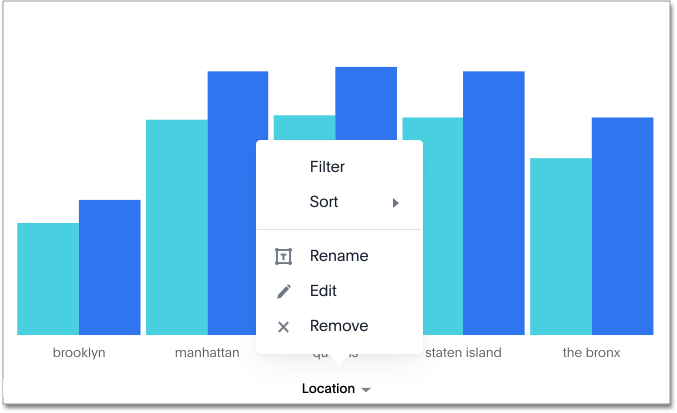
While viewing your answer as a chart, click the chart axis you want to filter on, and select Filter.

-
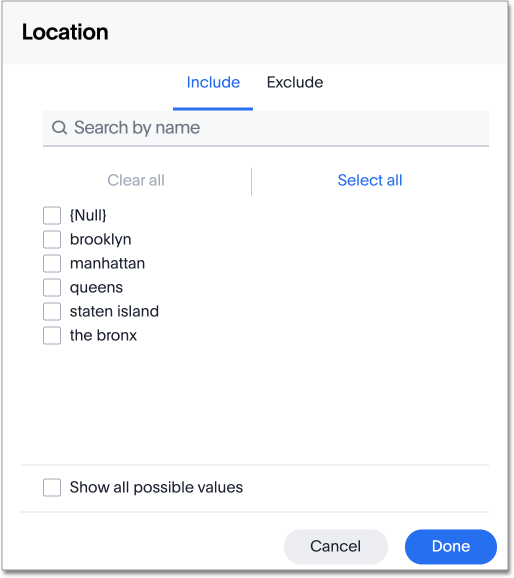
Select the values you would like to include in your answer.

-
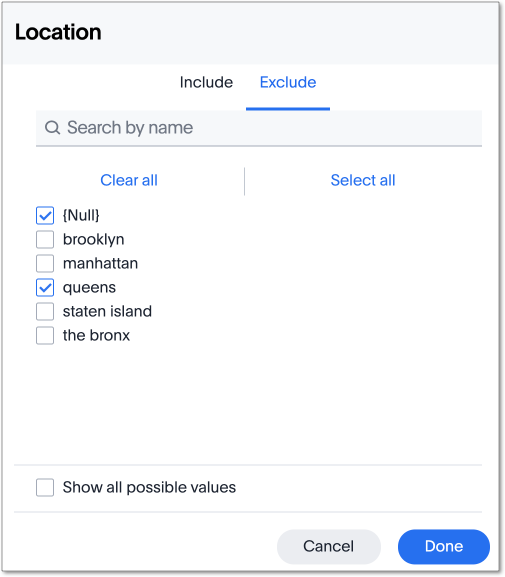
If you want to exclude values, click Exclude and choose values to exclude.

-
Click DONE.
If there are too many values, you can use the filter search bar to find the ones you want.
Related information


