Apply conditional formatting
Use conditional formatting to make portions of your results stand out.
You can apply conditional formatting to tables or charts to highlight values in the data. This makes values above, below, or within a particular threshold stand out.
Understand conditional formatting
Many companies create pinboards with key metrics they want to track in daily or weekly staff meetings. Using conditional formatting, they can see at a glance how they are performing relative to these metrics.
You can add visual cues for KPIs (Key Performance Indicators) or threshold metrics to charts and tables, to easily show where you are falling short or exceeding targets. These visual cues are called conditional formatting, which applies color formatting to your search result. For tables, you can add conditional formatting to set the background color of cells in a table based on the values they contain. For charts, you can add conditional formatting to show the threshold(s) you defined, and the data that falls within them will be shown using the same color.
Apply conditional formatting to a table
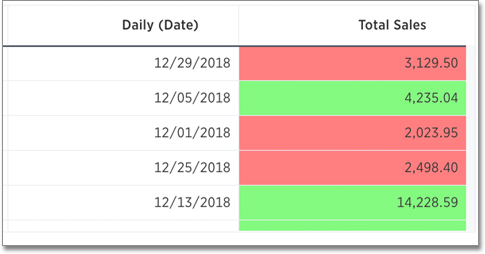
You can use conditional formatting to show table cells with a background color determined by the value they contain.
To apply conditional formatting to a table:
-
In the column header of your table for the column you want to apply formatting to, click the More menu icon
 .
.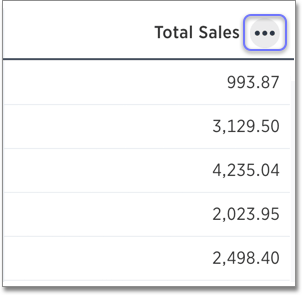
-
Select Conditional Formatting.
-
Click + ADD FORMATTING in the Conditional Formatting window.
-
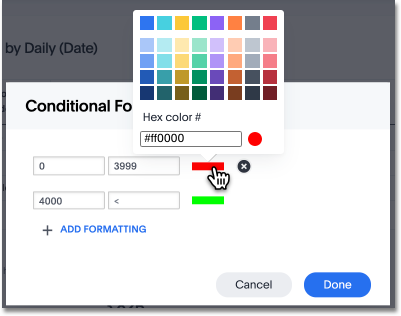
Define the sets of values and the color to use for each set.
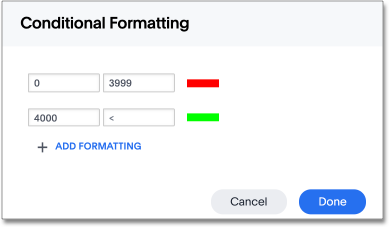
-
Click Done after defining all of your conditional formatting sets.
| If you change to a chart type, you must apply conditional formatting again. Conditional formatting is tied to the specific visualization. |
Apply conditional formatting to a chart
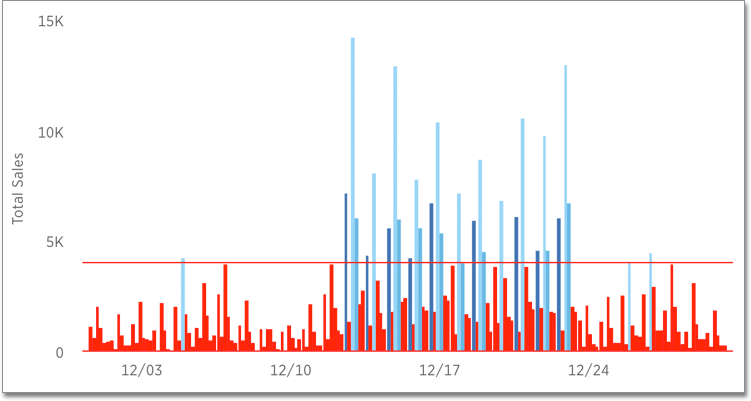
You can use conditional formatting to show charts with a target value or range drawn as a line in the chart, and the legend colors determined by where values fall relative to the target.
To apply conditional formatting to a chart:
-
Click the axis label of your chart. Select Conditional Formatting.
-
Click + ADD FORMATTING in the Conditional Formatting window.
-
Define the ranges of values and the color to use for each range you want to track. To add another range, click the + icon and repeat.
-
Click Done after defining all of your conditional formatting ranges.
| If you change the chart type, you must apply conditional formatting again. It is tied to the specific visualization. |
Limitations
The following chart types do NOT support conditional formatting:
-
Funnel
-
Geo area
-
Geo bubble
-
Geo heatmap
-
Heatmap
-
Pie
-
Radar
-
Sankey
-
Treemap


