Treemap charts
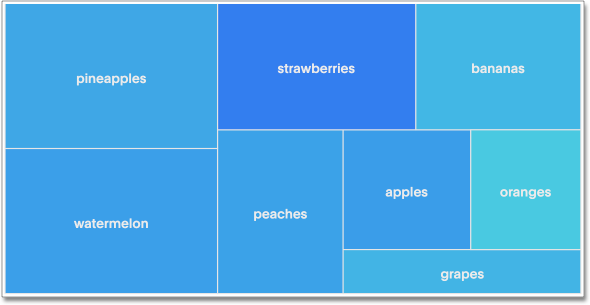
The treemap chart displays hierarchical data as a set of nested rectangles.
Treemap charts use color and rectangle size to represent two measure values. Each rectangle, or branch, is a value of the attribute. Some branches can contain smaller rectangles, or sub-branches. This setup makes it possible to display a large number of items in an efficient way.
You can rearrange the columns of your search into category, color, and size under Edit chart configuration.
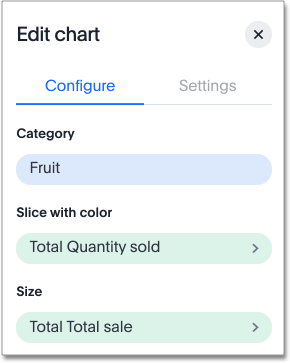
Your search needs at least one attribute and two measures to be represented as a treemap chart.
Was this page helpful?Give us feedback!


