System worksheets
Learn about the system Worksheets that ThoughtSpot provides.
Most of the monitoring information in System Health comes from system Worksheet which administrators can view, but not modify. The underlying tables are protected system tables that cannot be accessed directly. However, administrators can create new, custom monitoring reports from the Worksheets.
List the system worksheets
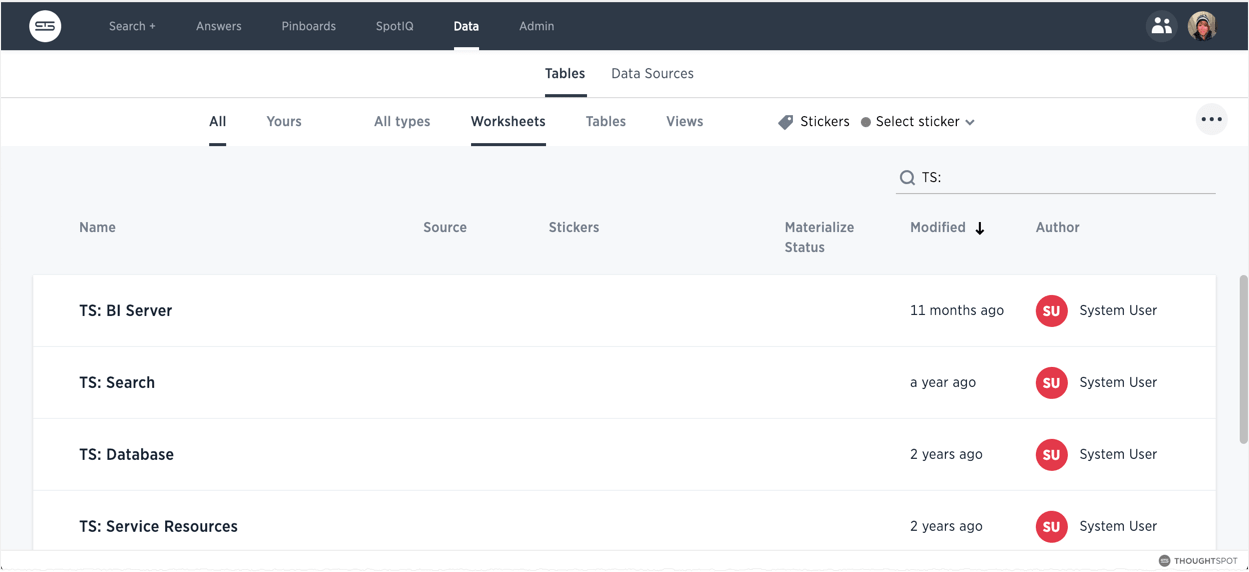
To list the system Worksheets:
-
Go to the Data tab.
-
Choose All and Worksheets.
-
Enter `TS: ` in the search field.
Summary of the worksheets
| Worksheet | Description |
|---|---|
Contains data related to the systems associated with underlying the ThoughtSpot BI server. This includes database latency, browser clients, size of responses, and more. |
|
TS: Database |
Contains information related to the database cache and queries run on the database. For example, you could use this Worksheet to see data on the query errors returned by the database. |
TS: Internal Capacity WS |
Describes cluster memory capacity by node over time. |
TS: Internal Table Wise Capacity WS |
Describes memory capacity by node, table name, shard count, and CSV replication over time. |
TS: Metrics |
Contains metrics by cluster and host over time. |
TS: Search |
Contains data related to the number of searches (queries) run in the system. This contains information such as uptime, host, and timestamps. |
TS: Service Resources |
Contains data related to cluster nodes including page faults, memory usage, memory failures, and more. |
TS: Table Info |
Describes the named tables by timestamp, row count, row shards, and row size. |
TS: Table Row Counts |
Describes the named tables by timestamp and row count. |
TS: Table Row Counts and Shards |
Describes the named tables by timestamp, row count, row shards, and row size. |
TS: Table Row Size |
Describes the named tables by timestamp and row size. |
TS: Table Shards |
Describes the named tables by timestamp and shard count. |


