Spotter capabilities
This guide showcases Spotter’s capabilities by showing examples of the various types of questions users can ask to extract actionable insights through intuitive, conversational queries.
Let’s take a look at how business users in a retail business can get insights about their day-to-day operations with the help of Spotter.
Level 1: Understanding your dataset
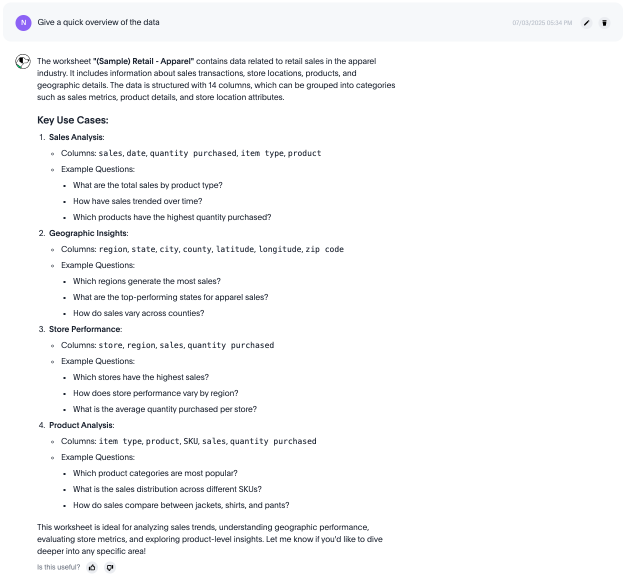
Before asking specific metric-based questions, you can ask Spotter to provide a high-level overview of the data. This helps you understand the dataset’s purpose, structure, available columns, and the key types of questions it is designed to answer. This helps you understand the dataset’s purpose, structure, available columns, and the key types of questions it is designed to answer.
| This capability is specific to the Spotter Agent experience. |
| Question | Description |
|---|---|
Give me a quick overview of this dataset. What is this data about? |
Asks Spotter to describe the dataset’s purpose, structure (for example, number of columns), and key categories of information (for example, sales metrics, product details, store attributes). |
What columns can I use? |
Lists the available columns, metrics, and attributes in the data model, helping you understand what you can ask about. |
What are the key use cases for this data? |
Prompts Spotter to suggest the types of questions and analyses the dataset is designed to answer, such as sales analysis or geographic insights. |
Show me some sample questions. |
Asks Spotter to provide examples of questions you can ask, demonstrating the capabilities of the model. |
Level 2: Basic questions
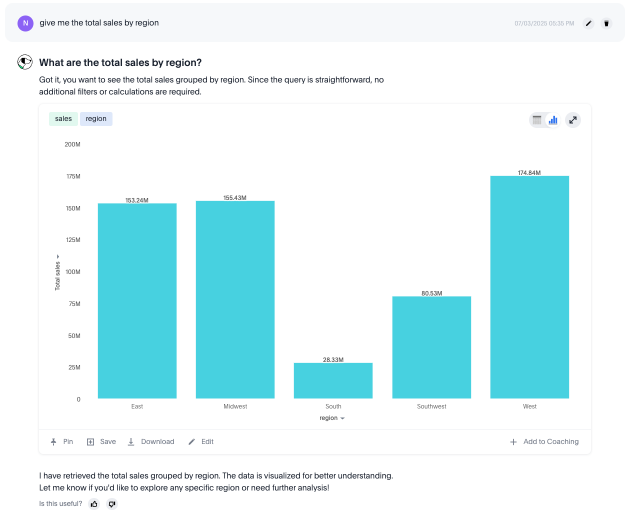
Beyond high-level summaries, you can ask more specific questions. This often involves computing summary statistics (like sum or average) grouped by specific attributes (like city or item type). You can also filter these questions using Spotter’s powerful date analysis capabilities, which include filtering for relative time periods (like 'last 10 days' or 'this year') and specific, absolute dates (like 'January' or 'today').
| Question | Description |
|---|---|
What is the average sales per city? |
Computes the average sales figure for each unique city in your data, enabling geographic performance comparison at a glance. |
Show the number of purchases by item type for this year. |
Analyzes purchase quantity across different product categories within the current year, revealing category performance. |
What was the total quantity purchased this week? |
Calculates the total quantity purchased within the current seven-day period, providing real-time insight into ongoing weekly performance. |
How many stores had purchases today? |
Identifies the count of stores with active transactions on the current day, providing real-time visibility into your retail network’s daily activity. |
Show me the total sales for Shirts item type in January of the current year. |
Isolates January sales performance for the Shirts category, enabling focused analysis on seasonal product performance. |
Show me this year’s quantity purchased for California vs Arizona. |
Provides direct state-to-state performance comparison, highlighting regional differences. |
Level 3: Complex compute questions
For deeper analytical insights, you can leverage Spotter’s advanced computational capabilities. This allows you to move beyond simple aggregations and ask questions that require more complex logic. For example:
-
Calculate growth (percentage change) of measures over time, such as year-over-year or month-over-month.
-
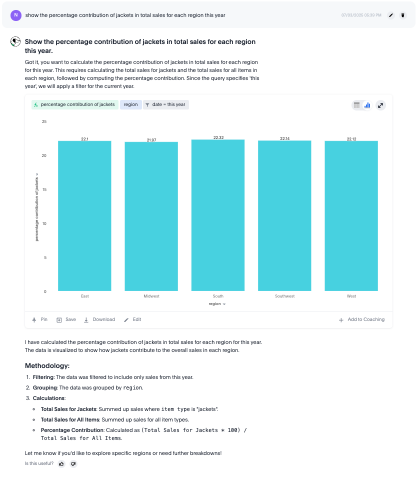
Perform arithmetic operations to derive ratios and percentages, like the percentage of total.
-
Analyze market share to measure performance relative to the total market.
-
Embed a query within another query, known as a subquery, to filter based on dynamically computed values (for example, "top 5 cities").
-
Apply conditional logic (if-then-else) to create custom categories or perform what-if analysis.
| Capability | Question | Description |
|---|---|---|
Growth |
Show the growth of sales year over year. |
Tracks annual sales growth rates over consecutive years, providing clear visibility into long-term business trajectory. |
Growth |
What is the growth of sales weekly for jackets for the last 8 weeks? |
Provides detailed week-over-week growth analysis for jacket sales across a 2-month window. |
Ratios/Percentages |
What is the percentage share of sales for each product? |
Calculates each product’s contribution to overall sales, providing a proportional view of your portfolio performance. |
Market share |
What is the market share of sales for shirts by region. |
Calculates the percentage of total sales that comes from shirts for each region. |
Subqueries |
What is the total sales of jackets only from the top 5 cities by sales? |
Performs targeted analysis by first identifying your highest-performing cities, then analyzing jacket sales within those markets. |
Subqueries |
Show products that did not have any sales in the last 3 months. |
Identifies potentially under-performing inventory by highlighting products with no recent sales activity. |
Conditional logic |
Show stores that had sales greater than $1000 yesterday and more than $500 today. |
Identifies consistently high-performing retail locations by applying multiple time-based sales thresholds. |
Conditional logic |
Show total sales by store for last month. Highlight stores as top performing… |
Calculates total sales per store, and then categorizes each store based on its sales using a conditional formula. |
Level 4: Why questions with automated change analysis
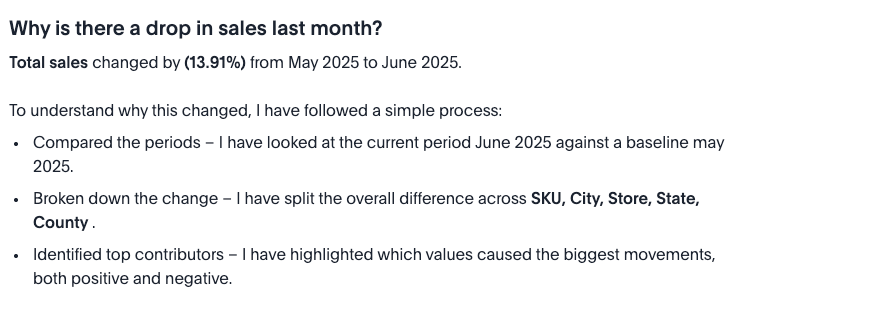
For deeper insights, you need to understand not just what happened, but why it happened. Spotter’s why capability moves you from surface-level observations to root-cause analysis within the same conversation. When you ask a direct question like, "Why did my sales drop last month?", Spotter leverages its change analysis engine to investigate the change.
It automatically performs a multi-dimensional analysis across relevant attributes to identify the key drivers. The results are presented with detailed visualizations and a clear, natural language summary that explains what contributed to the change, turning Spotter into a dedicated analyst.
| This capability is specific to the Spotter Agent experience. |
For more information, see Why questions in Spotter.
| Question | Description |
|---|---|
Why did my sales drop last month? |
Asks Spotter to analyze a recent time-based change (last month vs. the previous month) and identify the key drivers for the drop. |
Explain the change in website traffic last week compared to the week before. |
Prompts a direct comparison between two specific time periods to find what contributed to the difference. |
Why are churn rates higher in East than the West? |
Initiates a comparative analysis between two segments (East vs. West) to find the attributes driving the difference in the 'churn rate' metric. |
Why did sales drop in Q2? |
Analyzes a change over a larger, specific time frame (for example, Q2 vs. Q1) to identify key contributing factors. |