Geo charts
Geo charts show data on a map by location. There are three geo charts that let you visualize geographical data in ThoughtSpot: geo area, geo bubble, and geo heatmap charts. And these geo charts can display six types of geographical data, depending on territory:
-
Country
-
State
-
County
-
Zip code
-
Point (latitude/longitude)
-
Other sub-nation regions (for international countries)
ThoughtSpot supports maps for many countries. See the complete list in Geo Map Reference. If you would like to use a custom map to visualize your data, see Upload custom geo maps.
Displayed Geo data
Here is a table that shows which GeoType data can be displayed using which geo chart type.
| GeoType | Data Type | Geo chart type | Notes |
|---|---|---|---|
Country |
VARCHAR |
Geo area (default), geo bubble, geo heatmap |
Can also be regions. |
County |
VARCHAR |
Geo area (default), geo bubble, geo heatmap |
Only for counties in the United States. |
Latitude (point) |
VARCHAR or DOUBLE |
Geo bubble (default), geo heatmap |
Must use both latitude and longitude columns. |
Longitude (point) |
VARCHAR or DOUBLE |
Geo bubble (default), geo heatmap |
Must use both latitude and longitude columns. |
State |
VARCHAR |
Geo area (default), geo bubble, geo heatmap |
Only for states in the United States. |
Zipcode |
VARCHAR |
Geo bubble (default), geo heatmap |
Refer to the Geo Map reference to see which countries have supported zip codes. |
Other sub-nation regions |
VARCHAR |
Geo area (default), geo bubble, geo heatmap |
The display depends on the type of administrative region. |
For data to display in geo charts, your administrator must configure it as geographical data. If you don’t get an expected map visualization, contact your administrator so they can configure the system correctly.
See also:
Geo chart customizations
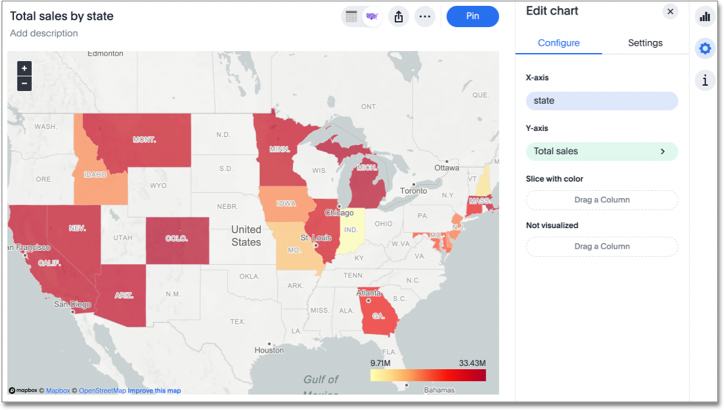
Geo charts allow you to customize the map display by changing the Map type.
To customize the Map type, follow these steps:
-
Navigate to any geo chart that you have edit privileges for.
-
Select the edit chart icon
 on the left side of your screen.
 -
Select Settings in the Edit chart panel.
-
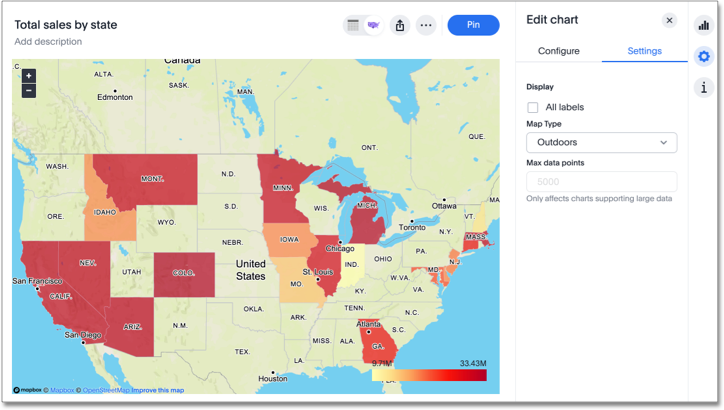
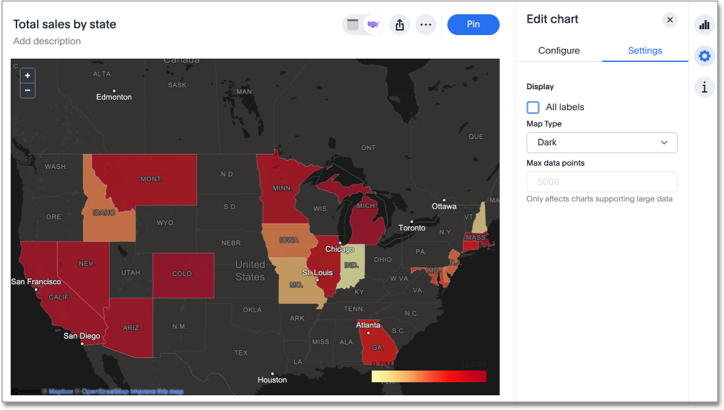
Click on the Map type dropdown, and select one of the options: Light, Dark, Outdoors, Streets, Satellite, or Satellite Streets. The default is Light.
For example, view the Light (default), Outdoors and Dark map types: