Introduction to monitoring
Learn how to monitor your system.
System monitoring tools in ThoughtSpot include an page and system logs. Additionally, ThoughtSpot provides several Worksheets and out-of-the-box system monitoring Pinboards. From these Worksheets, you can create your own custom visualizations and Pinboards. This page introduces these features and directs you towards more detailed information.
System Health center
The ThoughtSpot application includes a System Health center, for easy monitoring of usage, alerts, events and general cluster health. You view the System Health Center by choosing the Admin icon and then selecting System Health.
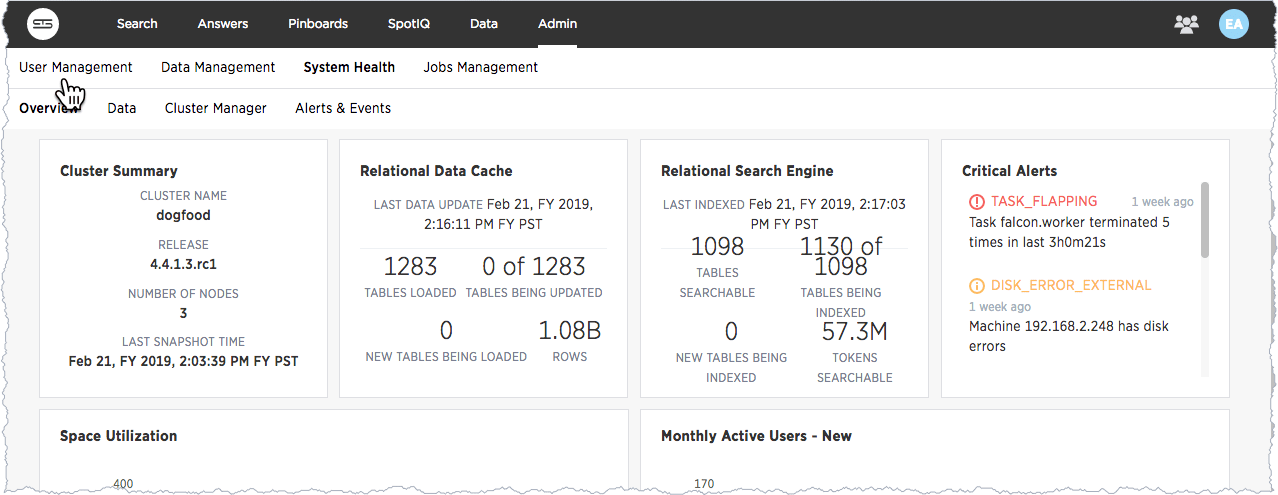
Only users with administrative privileges can view the System Health center. However, administrative users can present to others the information that displays in the System Health center.
Administrators can also create their own, custom boards that reflect system data in ways that are meaningful to specific departments or groups. For more information, see the following documentation:
Much of the data presented by these boards is also available through tscli commands.
Log files
Many of the administration commands output logging information to log files.
The logs get written into the fixed directory /export/logs, with a sub-directory for each subsystem.
The individual log directories are the following:
-
/export/logs/orion -
/export/logs/oreo -
/export/logs/hadoop -
/export/logs/zookeeper
System monitoring notifications
You can configure ThoughtSpot to send emails to addresses you specify with monitoring reports and a cluster heartbeat. Follow these steps to Set up monitoring.


