Hide and show values
You can hide and show values on the chart using the legend.
Clicking on a legend item will hide it from the chart, but does not delete it from your search. You can click the legend item again to show it. The legend appears when you have more than one column on an axis, or when you slice with color. To hide and show values:
On the chart, click the legend value you would like to hide. Click the hidden legend value again to show it.
Hide or show a column
Hide or show a sliced value
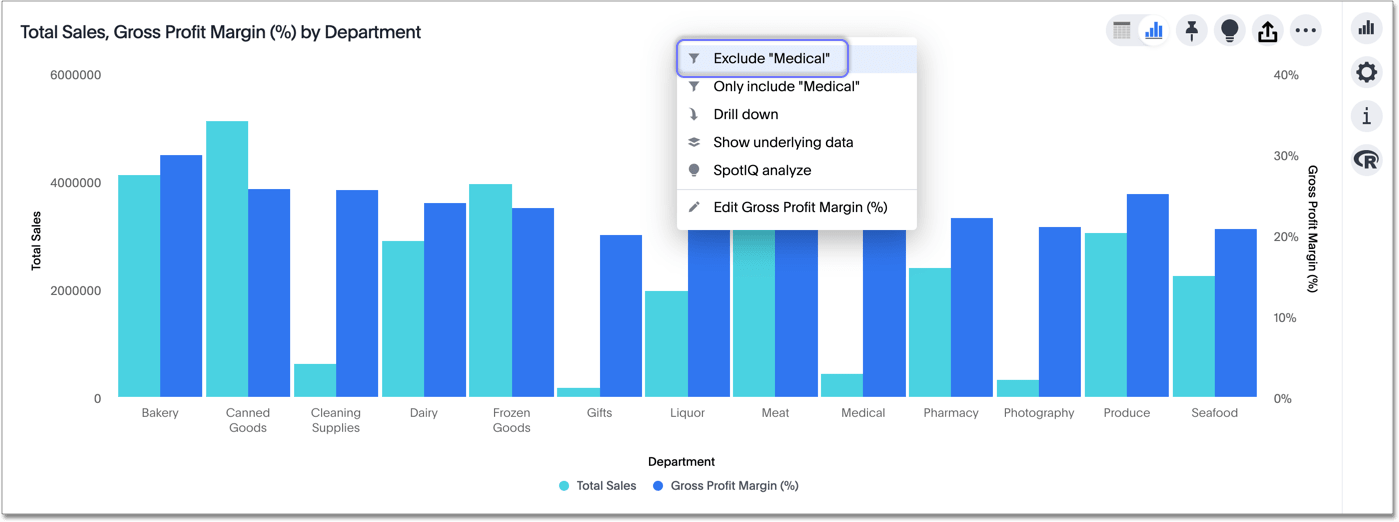
To exclude an item from a chart, such as a column or a pie wedge, right-click on the item and click Exclude "value".
Was this page helpful?Give us feedback!


