Create and share R scripts
You can create and share your custom R scripts in ThoughtSpot.
Overview
| Custom R is disabled by default. To turn on custom R scripting, contact your site administrator. |
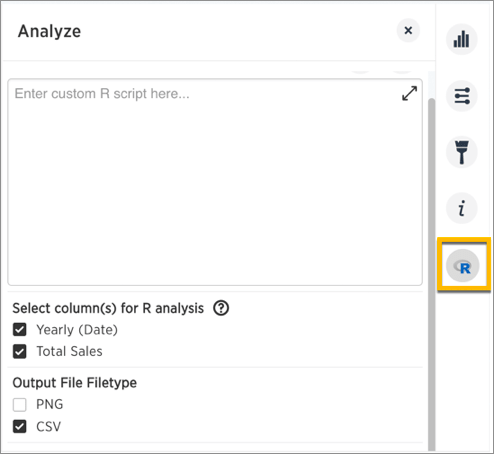
Each ThoughtSpot cluster is capable of running an R analysis on your data. To perform your own R analysis, start with a simple search and click the R icon on the right.
Use the Custom R Script dialog and settings to enter your script, set which columns to include for analysis, and indicate what output data to expect from your script (PNG or CSV).
ThoughtSpot also supports the sharing of scripts among users to enable you to share your powerful R analyses across the system, and allow others to run your scripts on different search results.
How it works
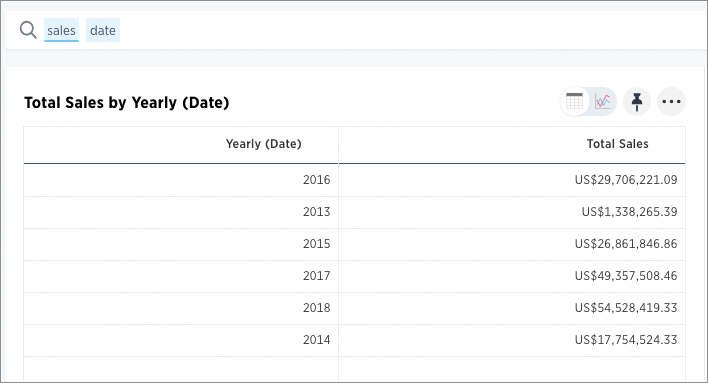
An R script in ThoughtSpot is based off of your original search (both the data and the schema), using the columns you select for the analysis. You can select all columns used in the original search or a subset of those columns, depending on the script.
ThoughtSpot auto generates objects with variable names by which you can refer to data elements in your script.
You can refer to the data in the selected columns by using vectors that ThoughtSpot generates for these before the script is run.
The first column you select has the variable name .param0, the second column you select has the variable name .param1, and so on.
This naming scheme continues if there are more columns.
(You can click the question mark icon ![]() next to "Select columns for R analysis" to get a visual mapping of how the columns are bound to variables in R.)
next to "Select columns for R analysis" to get a visual mapping of how the columns are bound to variables in R.)
ThoughtSpot also provides an automatically-generated data frame object, df, that contains all selected column vectors.
The data frame is R’s representation of a table (a 2D data structure containing rows and columns).
When the script executes, it passes the information to the server to run the analysis, and displays the answer as a visualization, in either PNG or CSV (table) format.
As we demonstrate in the following examples, you can chain R analyses together by running another R script on the answer to a previous script.
Write a custom script
To add a custom R script, start by running a search, then click the R icon ![]() on the toolbar.
on the toolbar.
Add your script into the Custom R Script dialog, and set the column bindings and output type appropriately, as shown in the following examples.
For an R script to produce a meaningful output in ThoughtSpot, the script should generate a CSV or PNG file.
Output should be written to the token #output_file#.
CSV output is rendered back as a simple table in ThoughtSpot, PNG output is rendered back as a static PNG.
Basic R script to generate CSV data
This is an example of a basic R script that generates CSV data.
(The df variable name must be lower case, as shown.)
write.csv(df, #output_file#)
The generated data is displayed back as a table when you run the analysis:
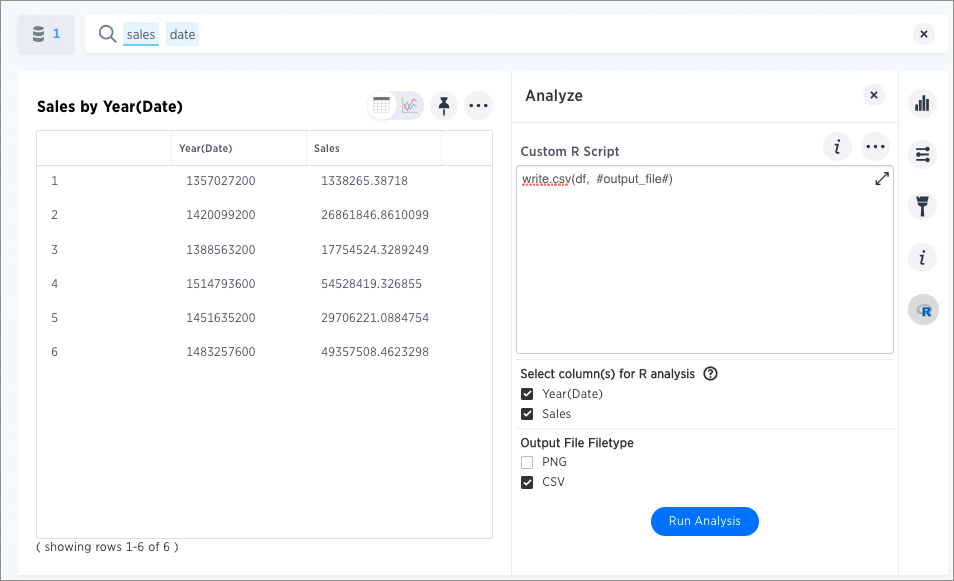
This basic script returns the same table results as if you did the query directly in ThoughtSpot and selected the table view, barring some additional formatting you get for free on the search.
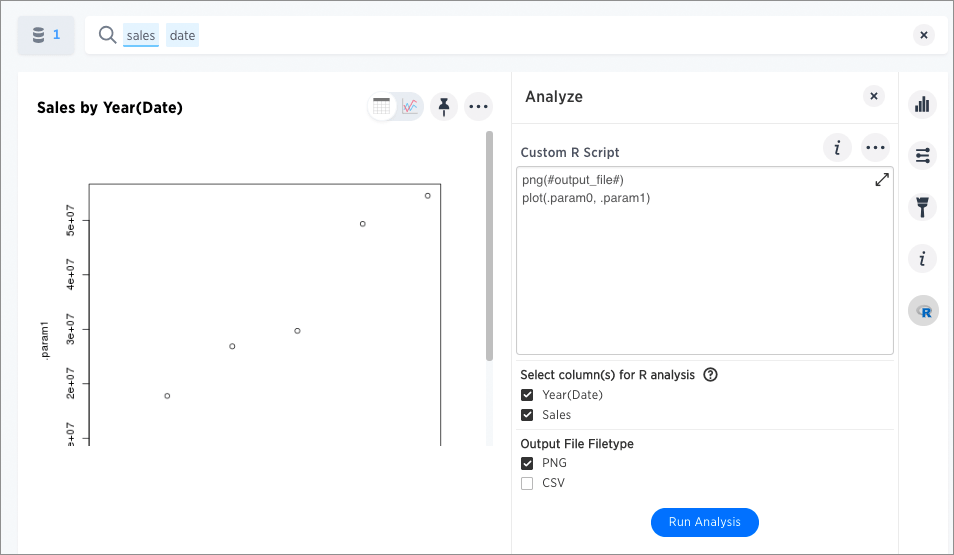
Basic R script to generate a PNG graphic
This is an example of a basic R script that generates PNG data as output.
png(#output_file#)
plot(.param0, .param1)
The generated data is displayed back as a static PNG when you run the analysis:
Column bindings and output file type
-
Under Select column(s) for R analysis, you specify the data you want to send to R and how to send it. If you do not make any choices here, all columns in the search are selected in the order they appear in the search bar.
In the examples above,
Year (Date)is.param0, andSalesis.param1. To verify this, click the question mark icon next to Select columns for R analysis to see the"column bindings". Reordering the columns changes the column bindings/params.
-
Under Output File Type Select PNG or CSV, depending on the output details and in your script.
Options on scripts
You can click these icons in the R script dialog to get more options:
-
The R script information icon
 provides a basic reference guide for creating an R analysis in ThoughtSpot.
 -
The ellipses icon
 provides a menu with options to save or load a previously saved R script, as well as share your R script with other users in the system.
 -
The arrow at the top right of the script dialog
 opens a popout editor that gives you a larger space in which to view and edit your R script.
 -
The question mark icon
 next to "Select column(s) for R analysis" provides a visual mapping of how the columns are bound to variables in R.
K-Means clustering example scripts
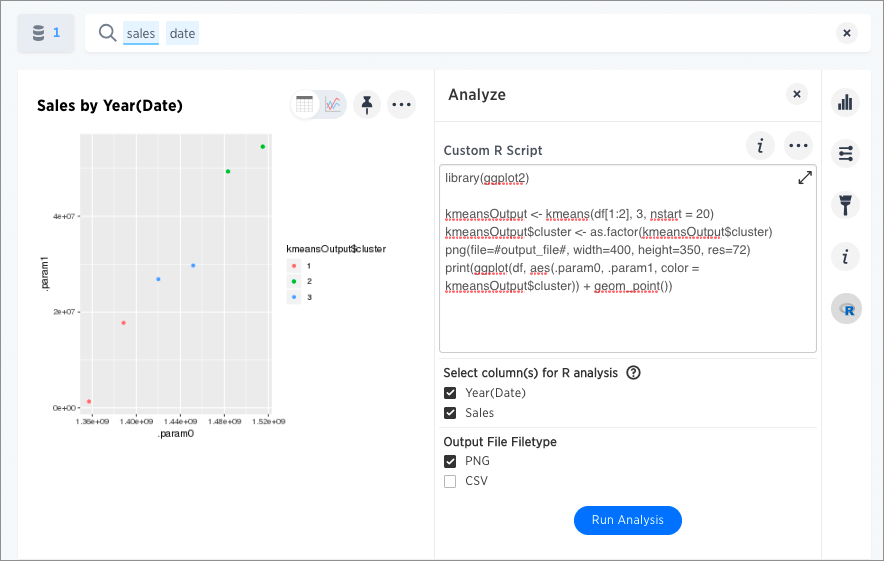
This script loads the ggplot2 visualization package, labels the columns inside of the ThoughtSpot generated data frame object (df), and runs a K-Means clustering algorithm.
library(ggplot2)

kmeansOutput <- kmeans(df[1:2], 3, nstart = 20)
kmeansOutput$cluster <- as.factor(kmeansOutput$cluster)
png(file=#output_file#, width=400, height=350, res=72)
print(ggplot(df, aes(.param0, .param1, color = kmeansOutput$cluster)) + geom_point())
When you run this script on the results of the original sales date search, you get the following visualization as a PNG.
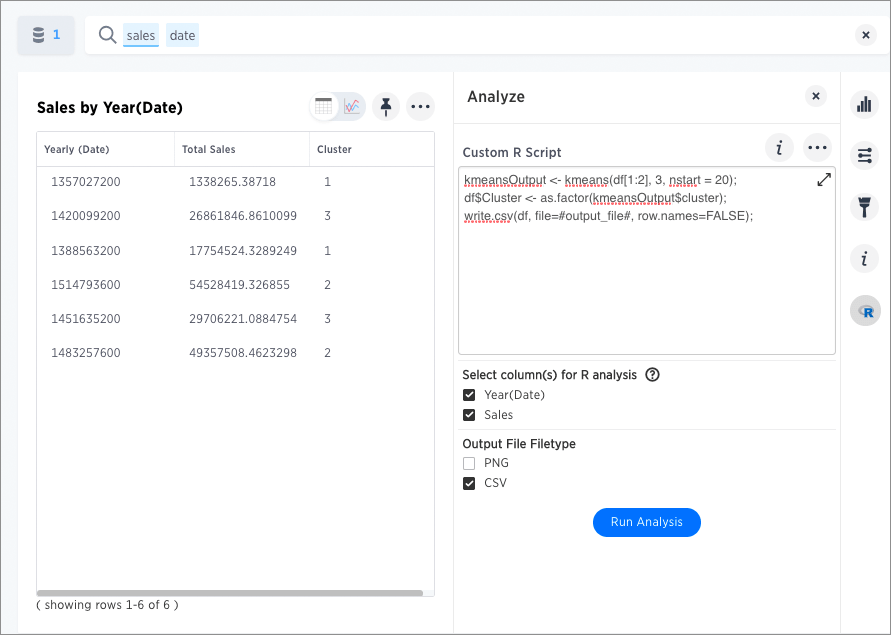
You can run another R script directly on this result to get CSV results:
kmeansOutput <- kmeans(df[1:2], 3, nstart = 20);
df$Cluster <- as.factor(kmeansOutput$cluster);
write.csv(df, file=#output_file#, row.names=FALSE);
The script for CSV output generates a table:
Save and share your script
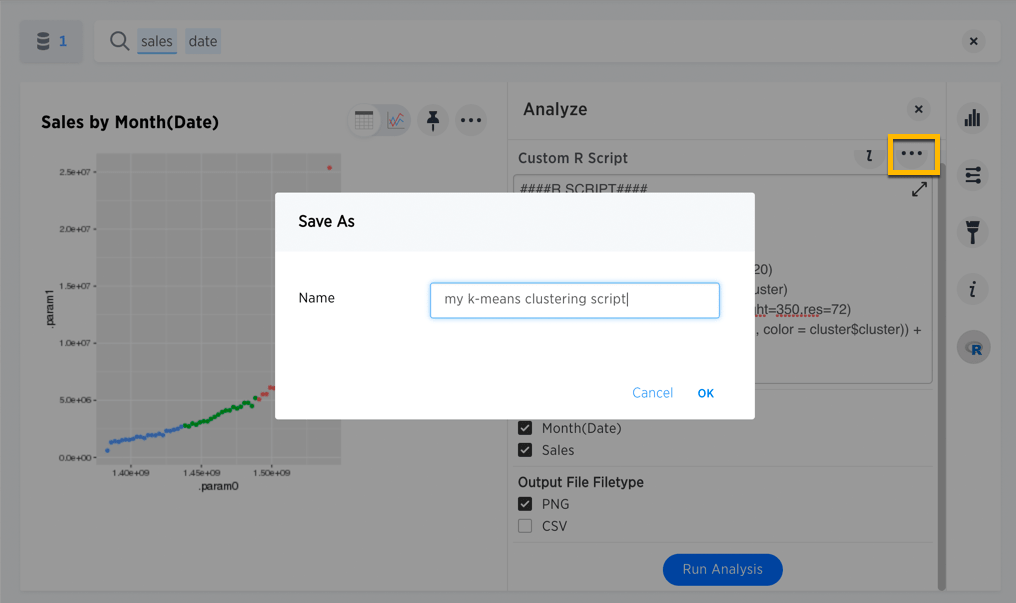
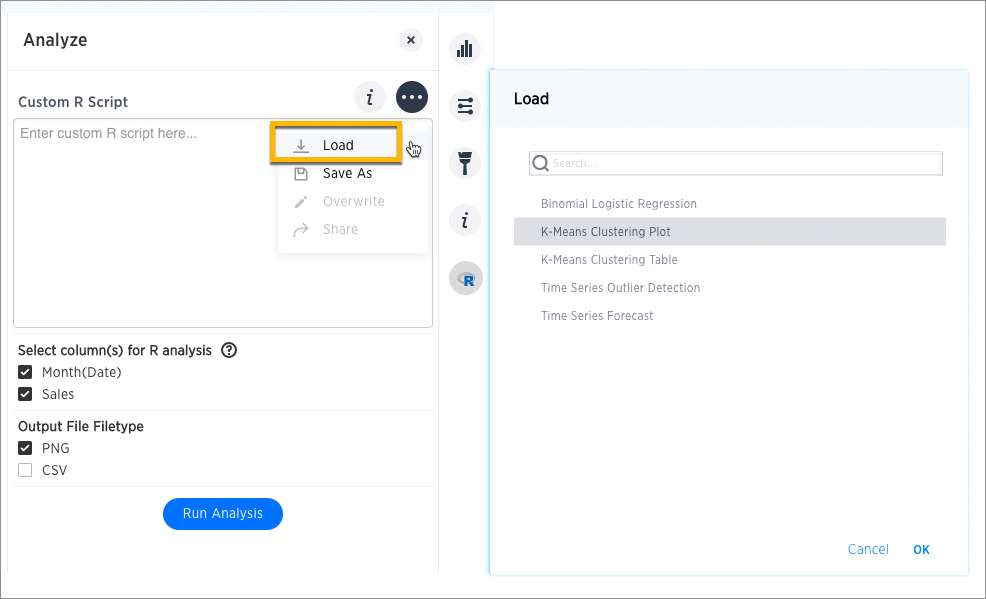
To save a script, choose Save as from the options menu ![]() of the script.
After you name and save it, your script will show in the Load scripts dialog.
of the script.
After you name and save it, your script will show in the Load scripts dialog.
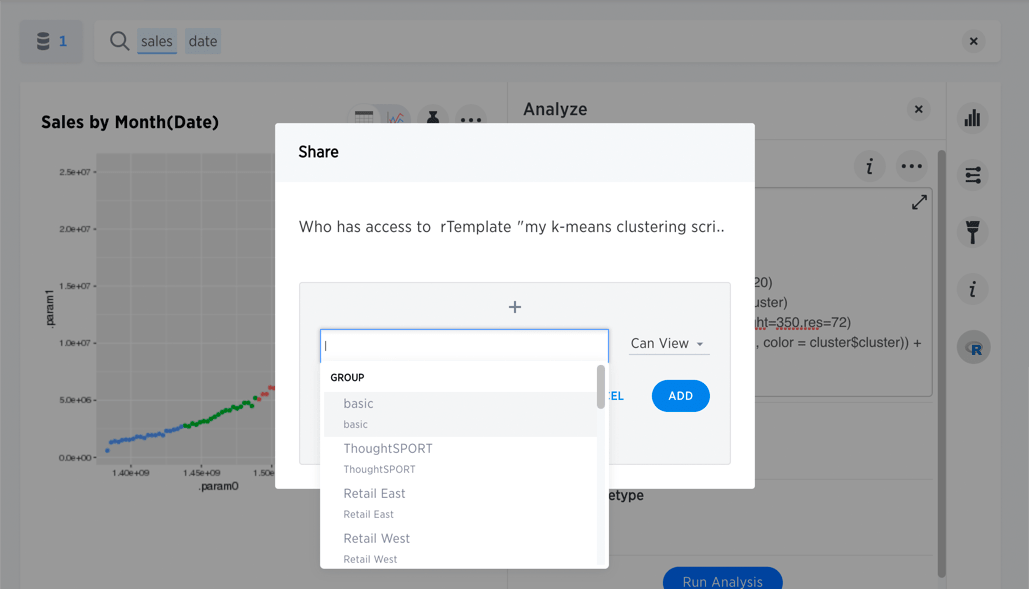
To share a script, choose Share from the options menu ![]() .
.
More script examples
For some more example scripts, check out the blog post on Using R Analysis in ThoughtSpot for Time Series Forecasting, or load one of the ThoughtSpot provided scripts:
-
Binomial Logistic Regression
-
K-Means Clustering Plot
-
K-Means Clustering Table
-
Time Series Outlier Detection
-
Time Series Forecast
Related information
Using R Analysis in ThoughtSpot for Time Series Forecasting (blog post by Antony Chen of ThoughtSpot)


