Comparative analysis
With SpotIQ comparative analysis, you can compare two data points for complex measures.
SpotIQ comparative analysis compares data points of simple or complex measures using these aggregates:
-
Sum
-
Count
-
Sum over sum, which generate a Pinboard that has 'what-if' percentage insights
-
Average, which generate a Pinboard that has 'what-if' percentage insights
-
Other functions which use a 'versus' analysis to show the absolute change grouped by different drill attributes
Basic comparative analysis in SpotIQ
To perform this analysis, follow these steps:
-
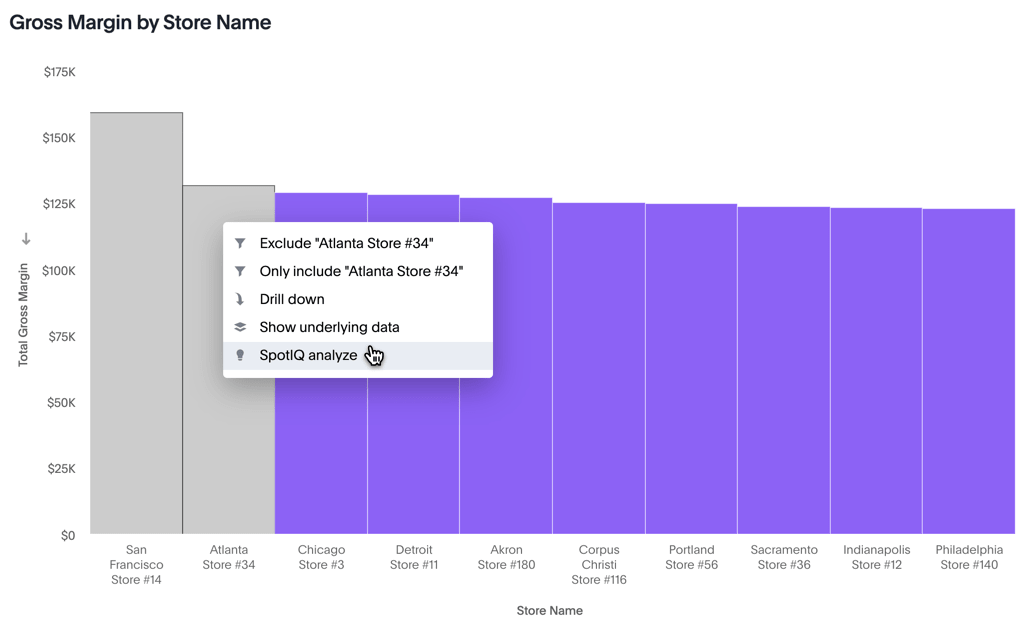
On a column chart, hold down the command key (Mac OS) or control key (Linux or Windows).
-
Click the two columns you plan to compare. Here, we are comparing the results for the San Francisco and Atlanta stores.
-
Right-click to see the drop-down menu, and select SpotIQ Analyze.
-
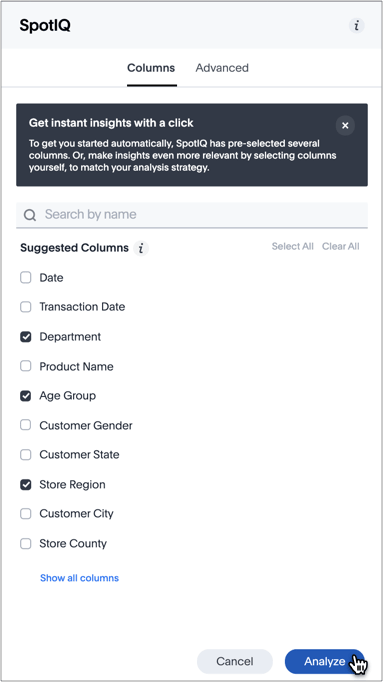
If you see the SpotIQ information modal, click Got it.
-
In the window modal, under Columns, select the columns for SpotIQ to compare. By default, SpotIQ picks the most relevant columns, based on what it learned from your past activity.
Here, we selected Department, Age Group, and Store Region.
Click Analyze.
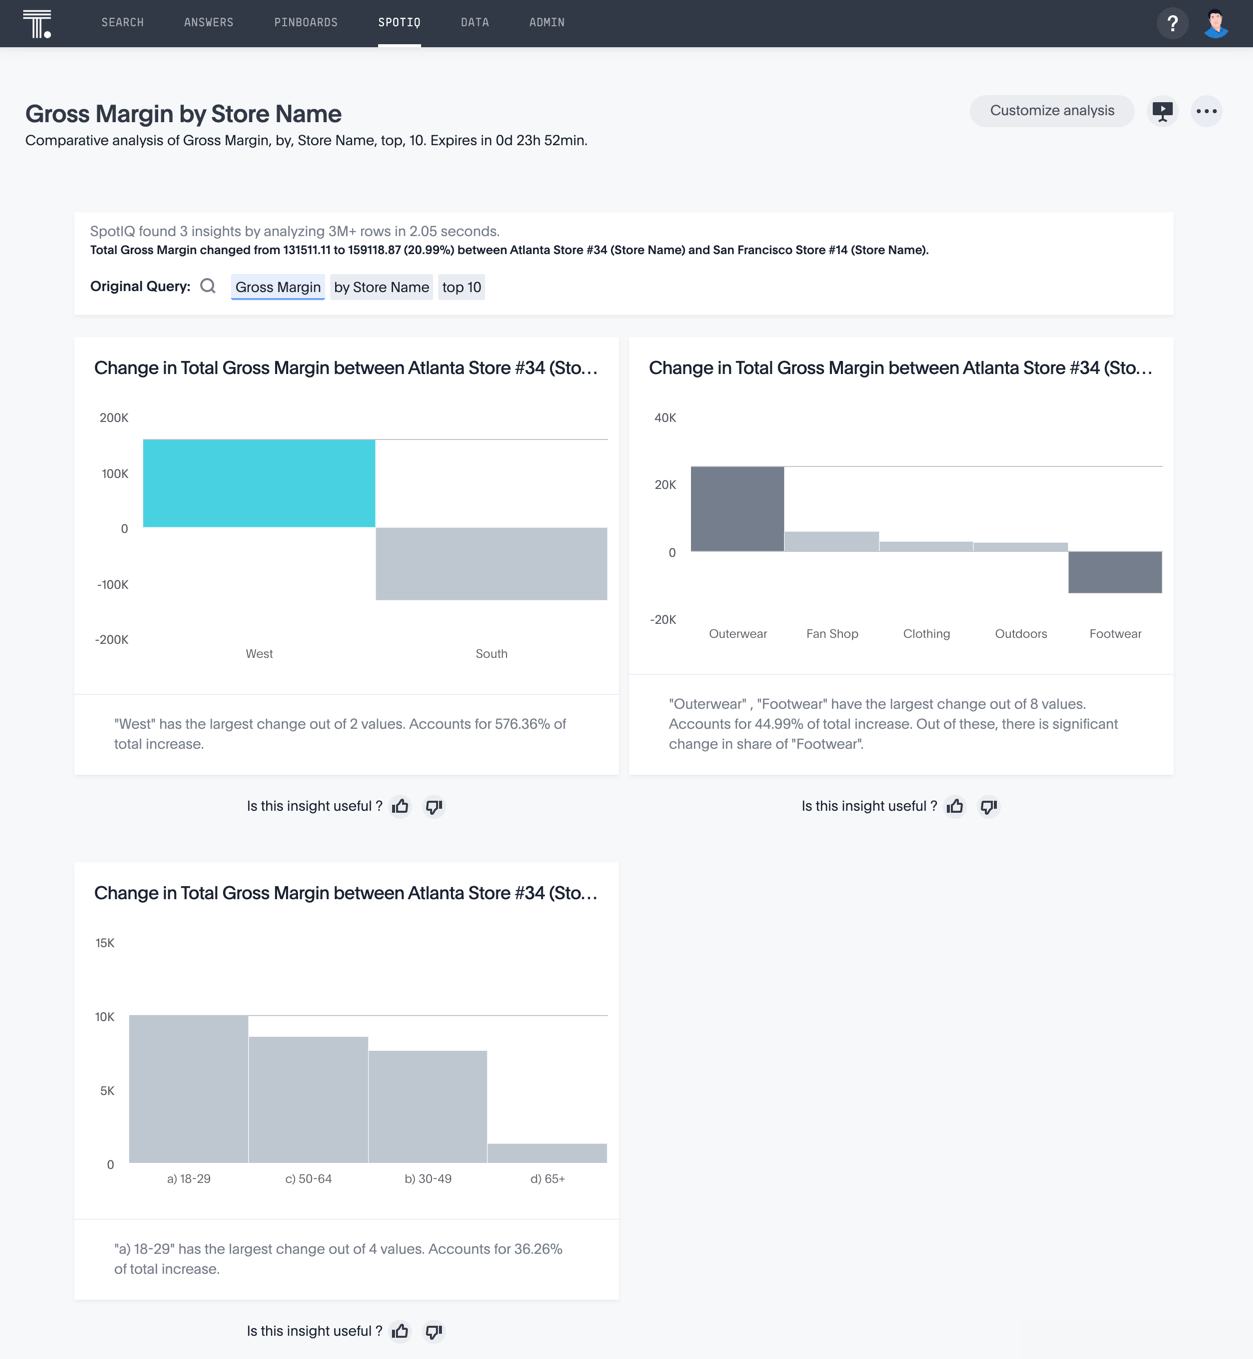
Viewing results
Notice that ThoughtSpot saves the results of SpotIQ analysis for 24 hours.
To view the results of your analysis, follow these steps:
-
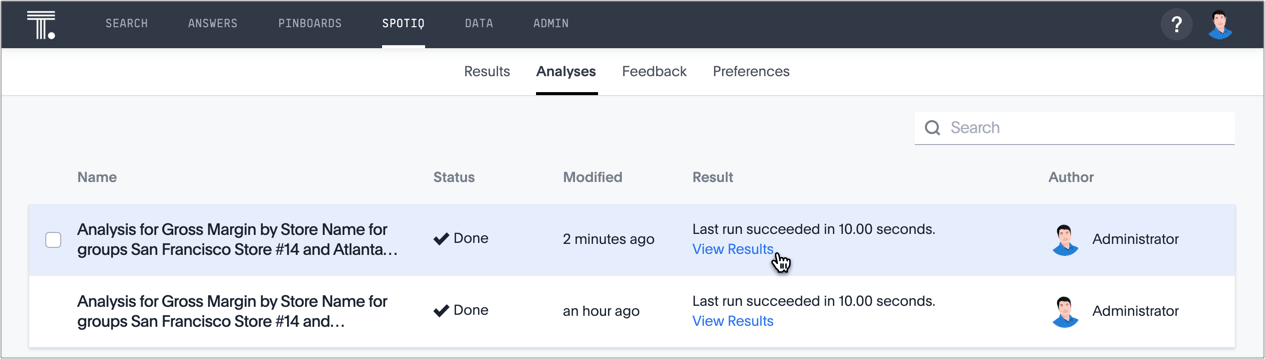
On the top navigation bar, click SpotIQ.

-
Select the Analyses tab.
Your analysis may be in progress. Wait until its Status changes to Done.
Click View Results to open the Pinboard.
-
In the report, SpotIQ generates a Pinboard with insights that compare the two selected points, grouped by the columns you chose for analysis.
-
You can now examine each visualization of the analysis for details of comparison, give feedback on its usefulness, and so on.
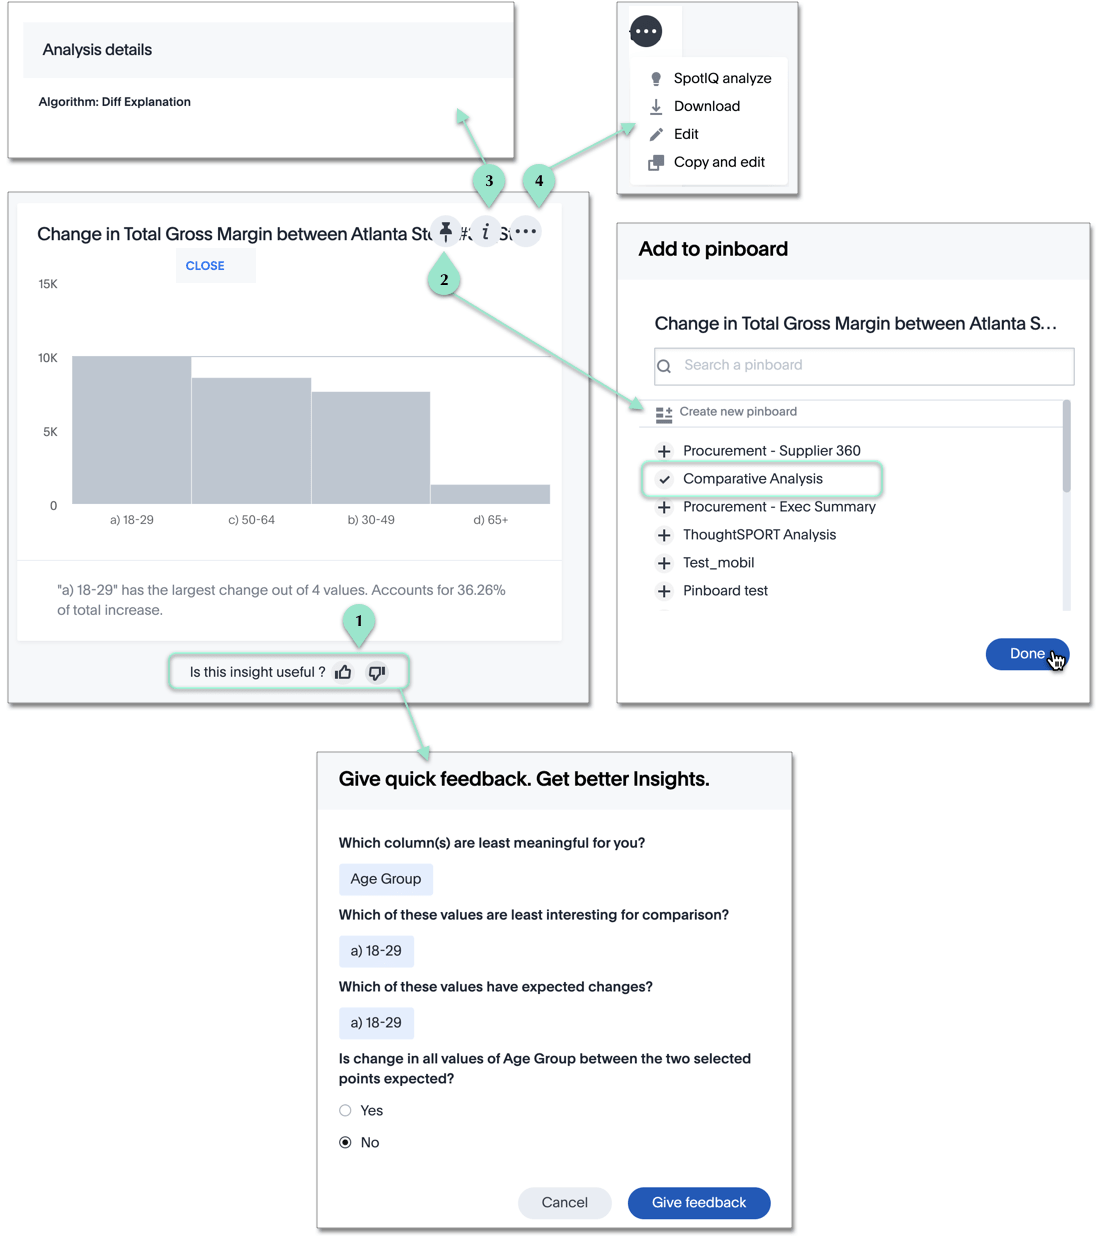
Legend Action Description 1.
Give feedback
SpotIQ learns how to improve its feedback based on the information you provide.
2.
Add to a Pinboard
You can add the specific visualization to an existing Pinboard, or create a new Pinboard and add it there.
3.
Analysis details
Get the name of the algorithm.
4.
More options
You can run another round of SpotIQ analysis, download the data as a CSV file, edit this visualization, or edit a copy of the visualization.
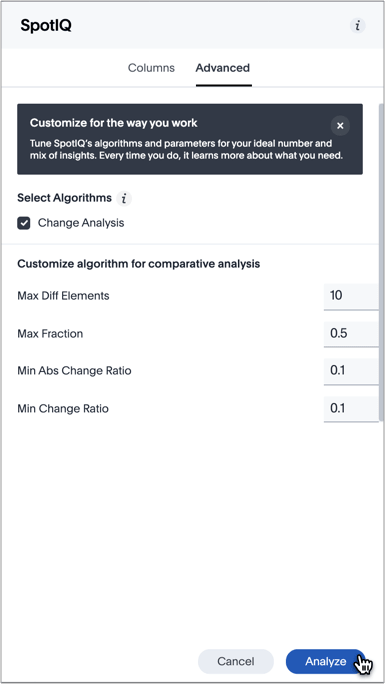
Advanced comparative analysis in SpotIQ
ThoughtSpot ships with a number of comparative algorithms. Using the Advanced option of SpotIQ, you can adjust the parameters of the analysis, or choose a different comparative algorithm for your data.
After selecting the relevant analysis columns, click the Advanced tab.
Under Select Algorithms, select the name of the algorithm. You may have several options available, or only a single one. In this example, the only valid option is Change Analysis.
Under Customize algorithm for comparative analysis, adjust the options. In this example, the algorithm parameters are Max Diff Elements, Max Fraction, Min Abs Change Ratio, and Min Change Ratio.
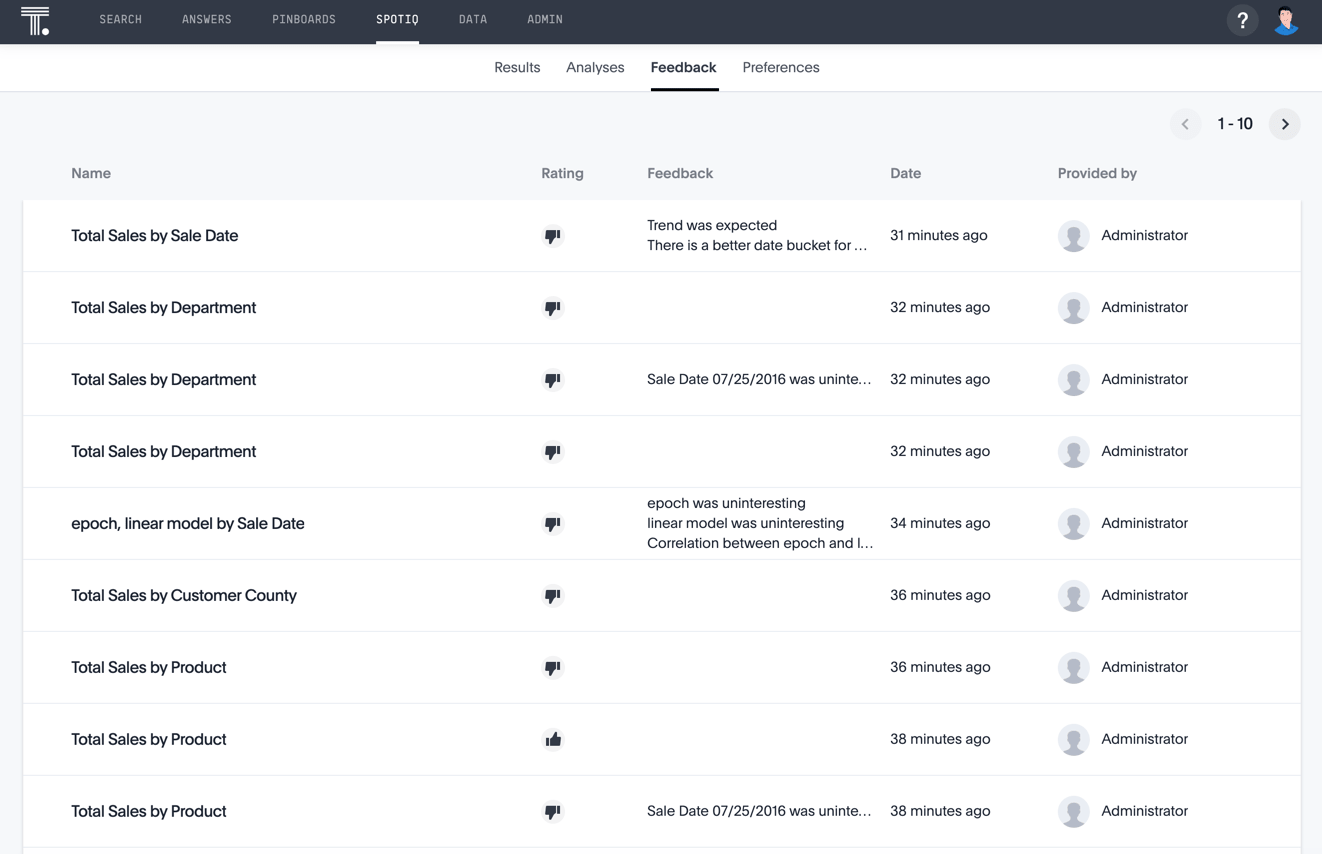
On the SpotIQ Feedback tab, you can see all SpotIQ feedback gave. Insights that you disliked are pushed to the bottom of the list.