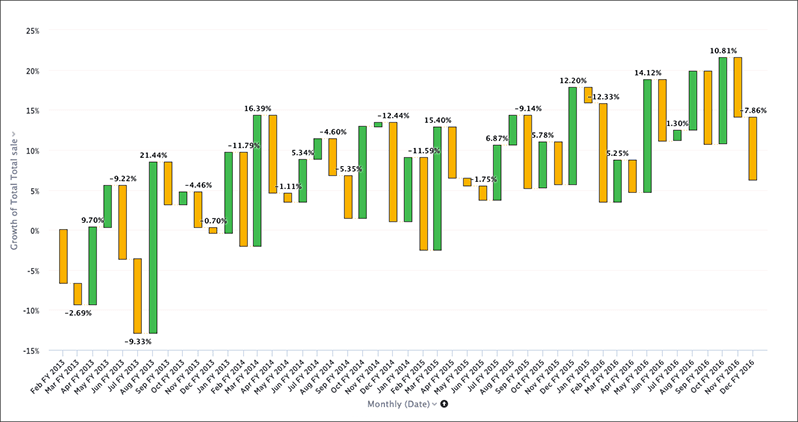
Waterfall charts
The waterfall chart shows how an initial value is affected by a series of intermediate positive or negative values.
Waterfall charts are good for visualizing positive and negative growth, and therefore work well with the growth over time keyword. The columns are color-coded to distinguish between positive and negative values.
Your search needs at least one attribute and one measure to be represented as a waterfall chart.
Was this page helpful?Give us feedback!


