Stories
Introduction
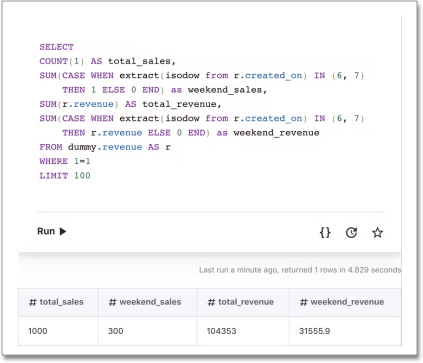
SeekWell’s Stories allow you to write narratives about your data using SQL. Think of them as an always up-to-date Wall Street Journal article about your company, automatically refreshed and delivered to your inbox daily. For example, using this SQL:
You can write a story like the following:
Selecting = allows you to access all your SQL results and add them to the Story. The output is rendered below the editor as you type. You can format the Story (using H1, H2, bold, for example) and add HTML and JavaScript snippets.
Stories are useful for short regular updates (for example, daily metrics) or alerts (for example, a canceled subscription). Stories can be shared via email, Slack, or in SeekWell Dashboards. Get started here.
Adding data (single data points)
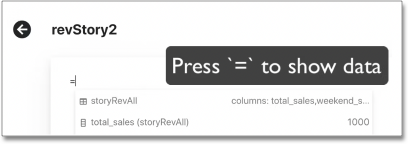
Once you type =, you see all saved query results with exactly one row (Note: to save a result, simply title the block). Press return or click to select a data point, and it will be added into the story.
Adding Formulas and Javascript
You can perform math (including references to data points) within the Story using double curly braces, {{2 + 2}} or logic (1 < 2) ? 'down' : 'up'.
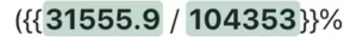
| This will render .30239, see Formatting below to clean that up. |
You can also condition on single data points by adding the single data point (see above) inside double curly braces, such as {{("total_sales"."sales_this_week" > "total_sales"."sales_last_week") ? 'up' : 'down'}}. If you had a block titled "total_sales" with columns "sales_this_week" and "sales_last_week", then this would render as 'up' when sales_this_week is greater than sales_last_week, and 'down' otherwise.
SeekWell Stories allow JavaScript and HTML within braces, as in the example below:
If 2 is greater than 1 then we celebrate! {{2 > 1 ? `<img height="200" src="https://media.giphy.com/media/doPrWYzSG1Vao/giphy.gif">` : '<img src="https://media.giphy.com/media/14aUO0Mf7dWDXW/giphy.gif">'}}

But if 2 is less than 3 we failed 😞{{2 > 3 ? `<img src="https://media.giphy.com/media/doPrWYzSG1Vao/giphy.gif">` : '<img src="https://media.giphy.com/media/14aUO0Mf7dWDXW/giphy.gif">'}}
If you are new to JavaScript, the main point to understand is how the conditional operator works. In short, the JavaScript code:
value > 100 ? 'yes' : 'no'translates to: IF value > 100 THEN 'yes' ELSE 'no'.
|
Formatting
| You can format results in SQL as a string, however, you won’t be able to do math on those results while writing a Story. |
Commas
{{(1000000).toLocaleString()}}Currency
${{(1000000).toLocaleString()}}
OR
{{"$"+(1000000).toLocaleString()}}
Rounding
{{Math.round(1.1)}}Round with decimal
{{(1.12523).toFixed(2)}}Percents
{{Math.round(.3*100)}}%Links
``{{`<a href="https://example.com" target="_blank">Click here!</a>`}}``Images / GIFs
``{{`<img height="200" src="https://media.giphy.com/media/doPrWYzSG1Vao/giphy.gif">`}}``Adding Tables / Blocks
You can add the results of any existing block to a Story. Make sure to first title the block you want to add, or it will not appear in the autocomplete when you search. This feature is currently limited to 20 rows and 20 columns, contact us if you need more.
To add blocks to a Story, follow these steps:
-
Type
=and start typing the title of your block. -
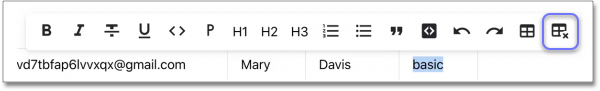
To delete a block, highlight a cell in the table to bring up the menu and select the "Table X" icon (last button in image below).
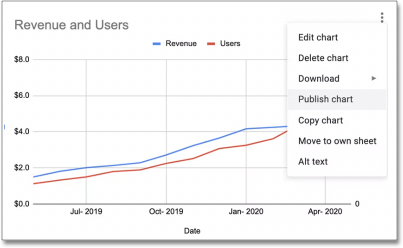
Add charts from Google Sheets
-
Select "Publish chart" from the menu on the chart.
-
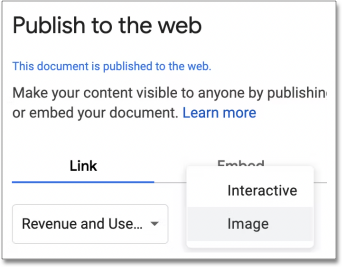
Select "Image" as the type.
-
Copy the link.
-
Replace
YOUR_LINK_HEREwith your link in the snippet below:``{{`<img height="200" src="YOUR_LINK_HERE">`}}``


