New line charts
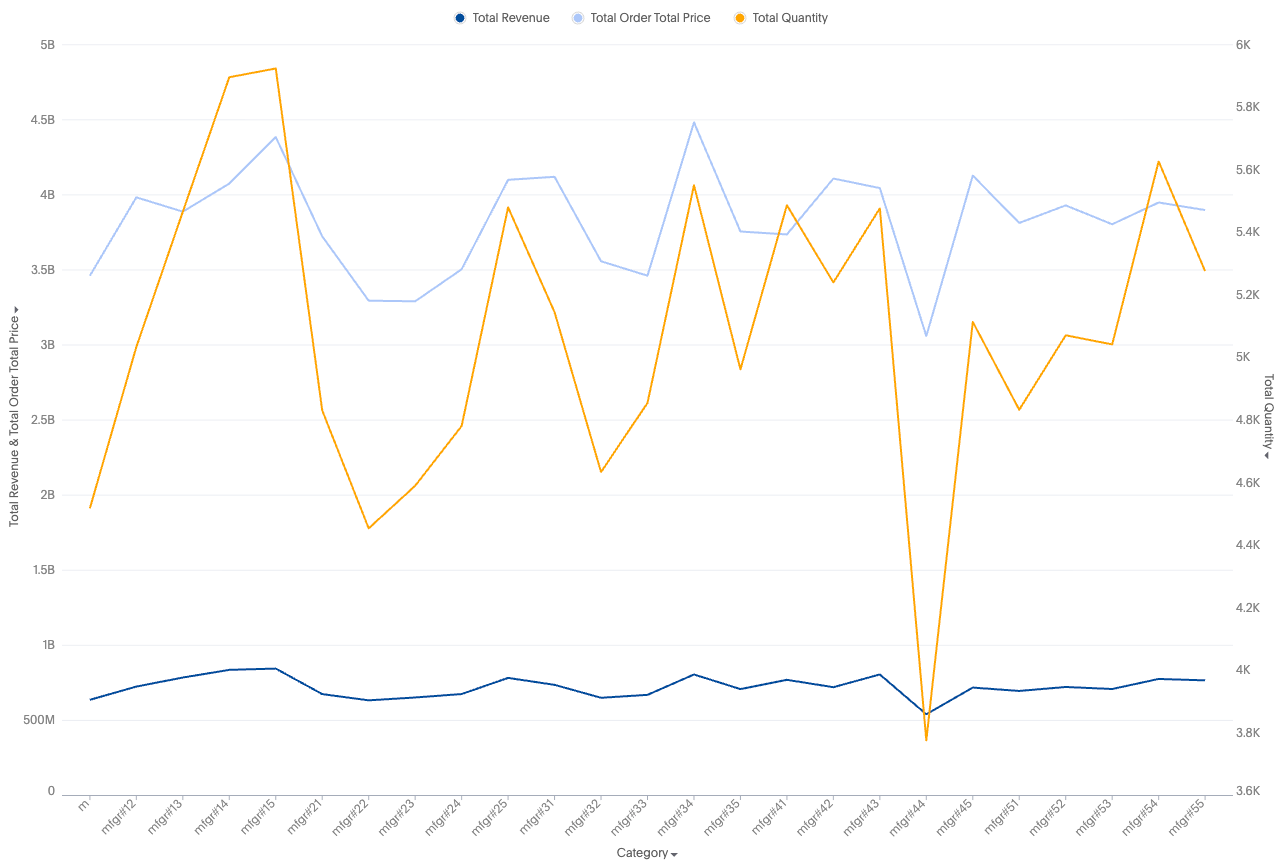
Like the new column chart, the new line chart is one of ThoughtSpot’s simplest, yet most versatile chart types. More often than not the line chart will be chosen as your default chart type.
New line charts displays your data as a series of data points connected by straight line segments. The measurement points are ordered by the x-axis value.