Pivot table
One value
This example will walk you through how to create a simple pivot table when you’re breaking down one value across multiple dimensions.
-
Add discrete fields to either Rows or Columns. These are the groups that you want to aggregate your value by. You can have as many groups as you’d like.
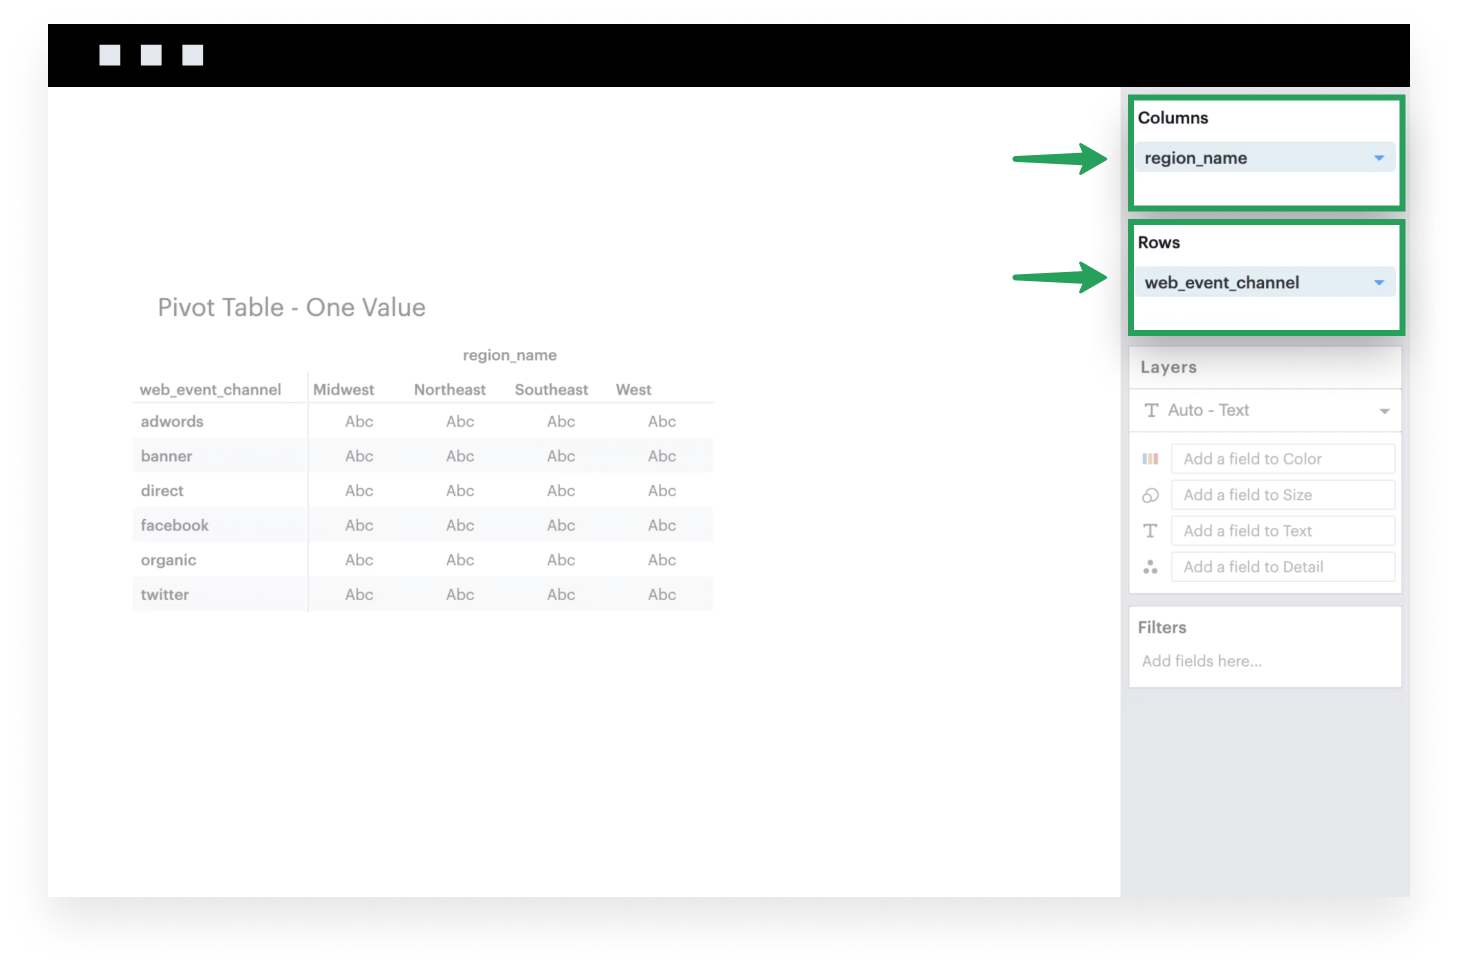
-
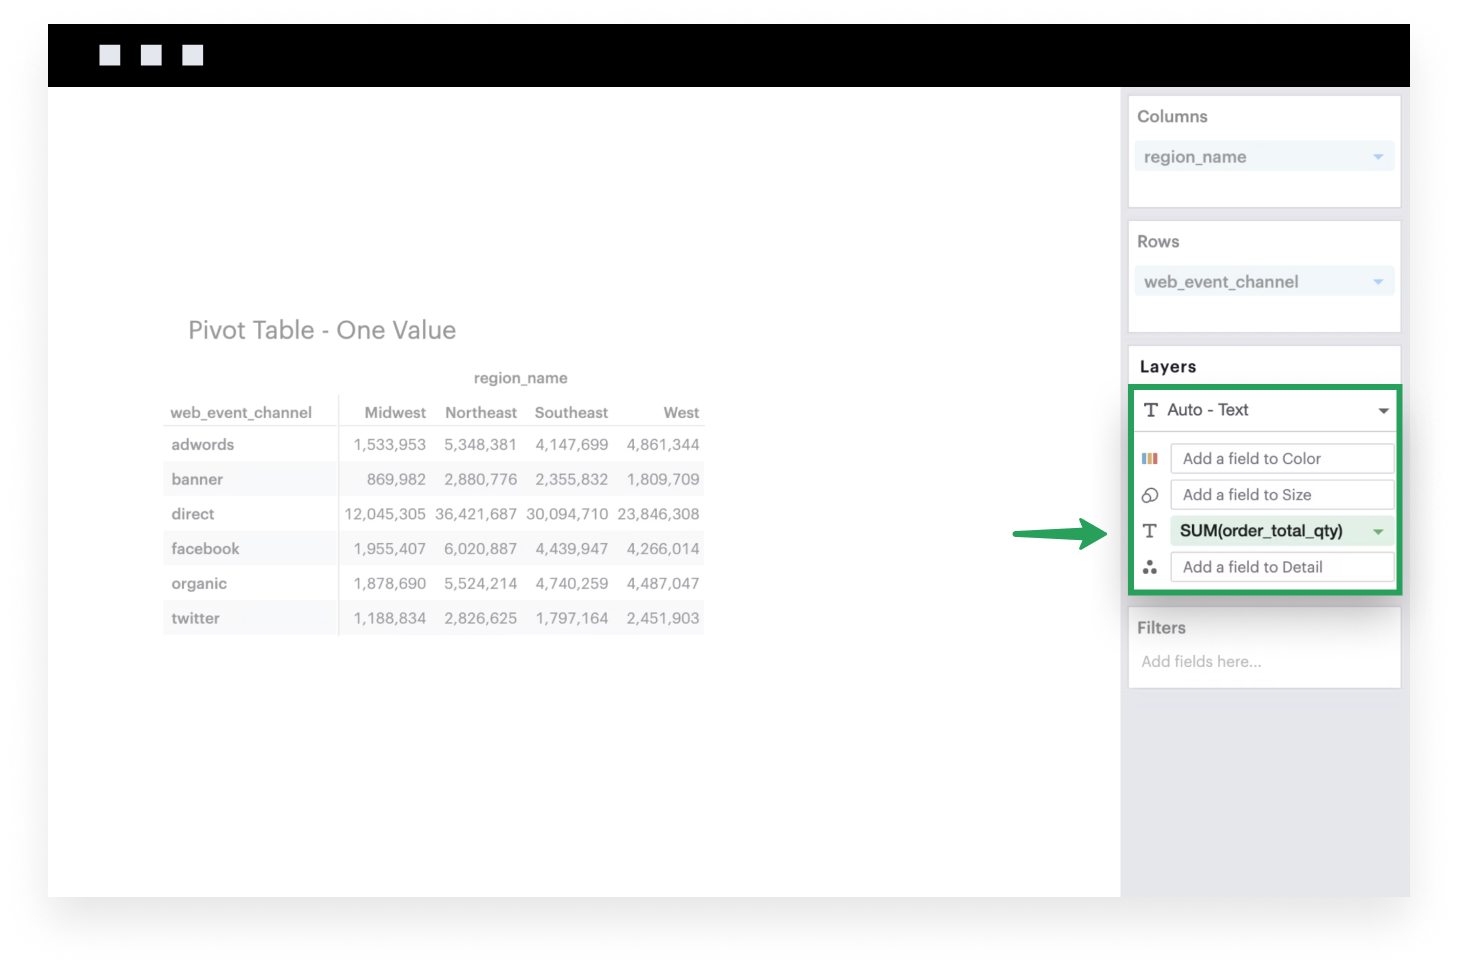
Add a continuous, aggregated field to the Text channel.
Multiple values
This example will walk you through how to create a simple pivot table when you’re breaking down multiple values across multiple dimensions.
-
Add discrete fields to either Rows or Columns. These are the groups that you want to aggregate your value by. You can have as many groups as you’d like.
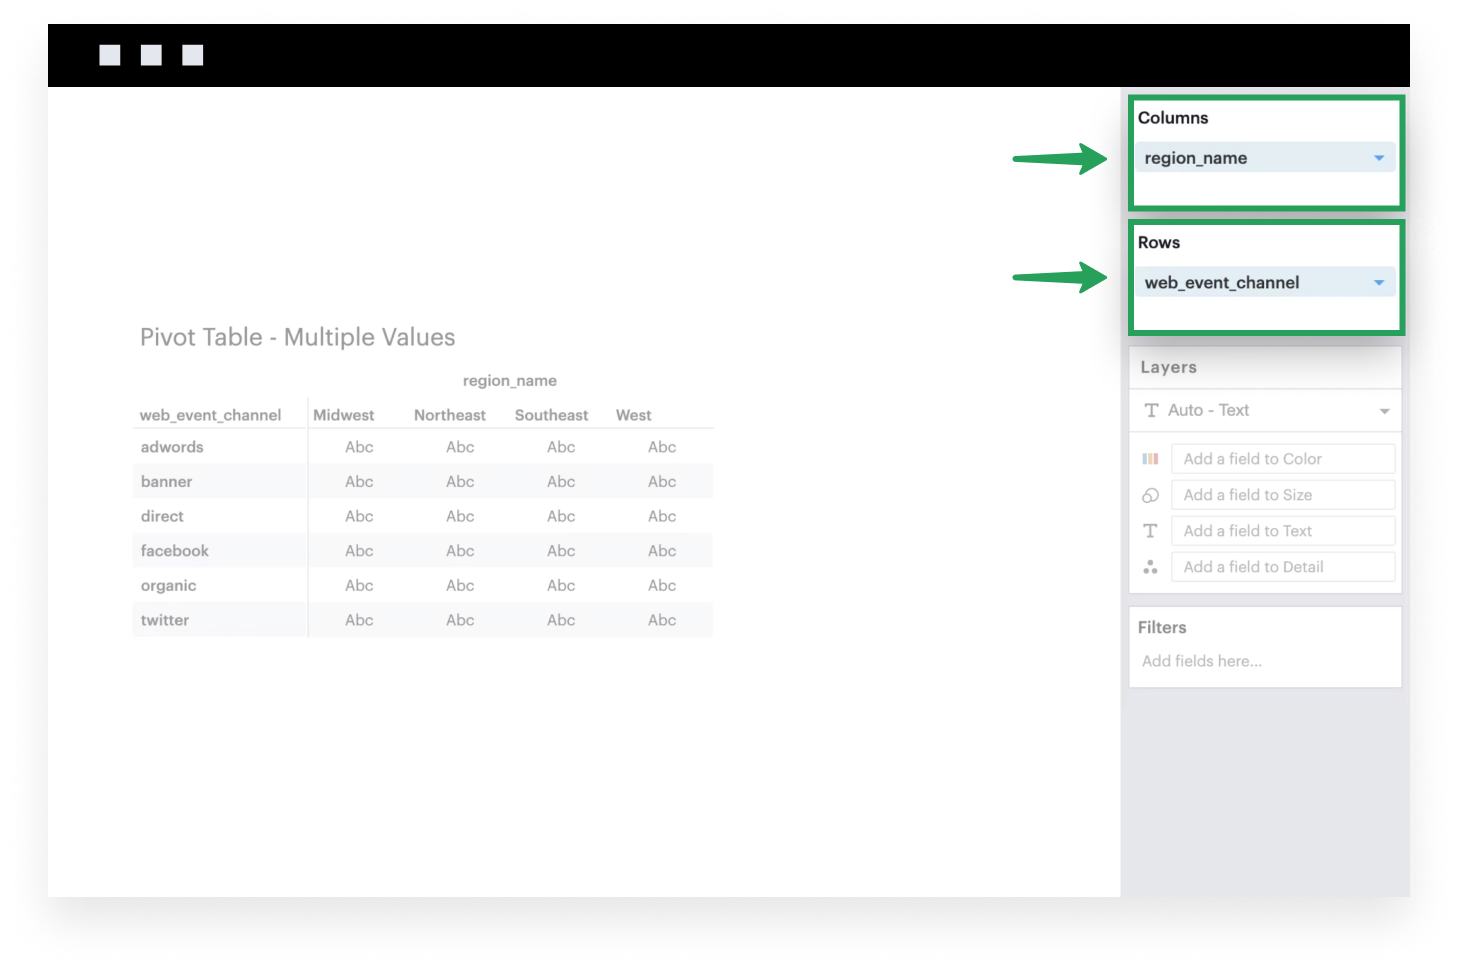
-
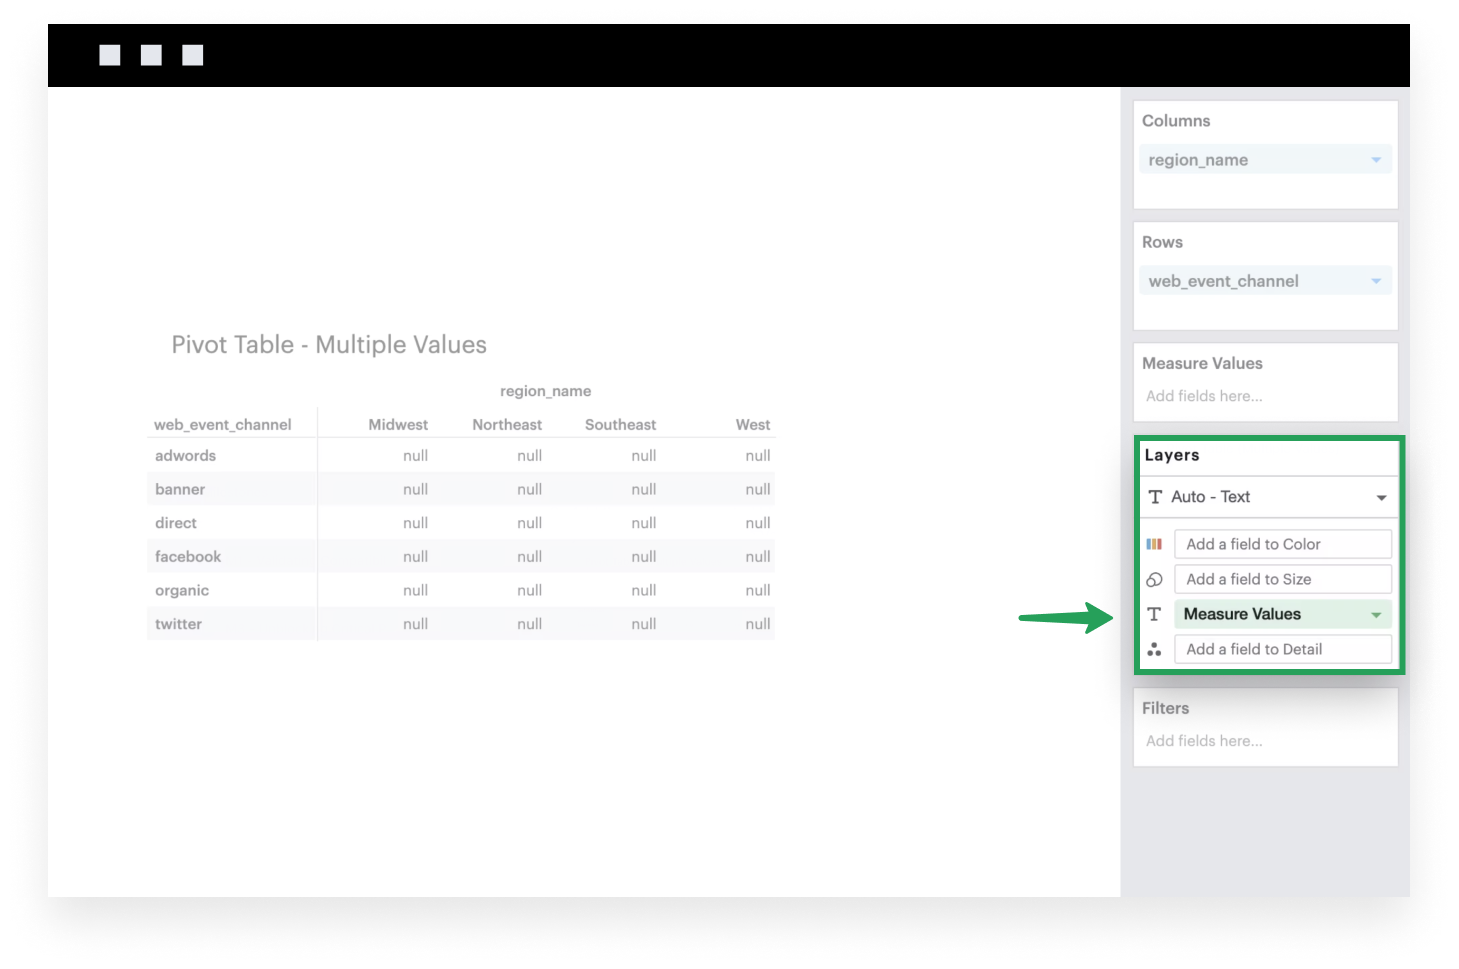
Add the system-generated Measure Values to the Text channel. After you do this, you’ll see that the Measure Values shelf appears.
-
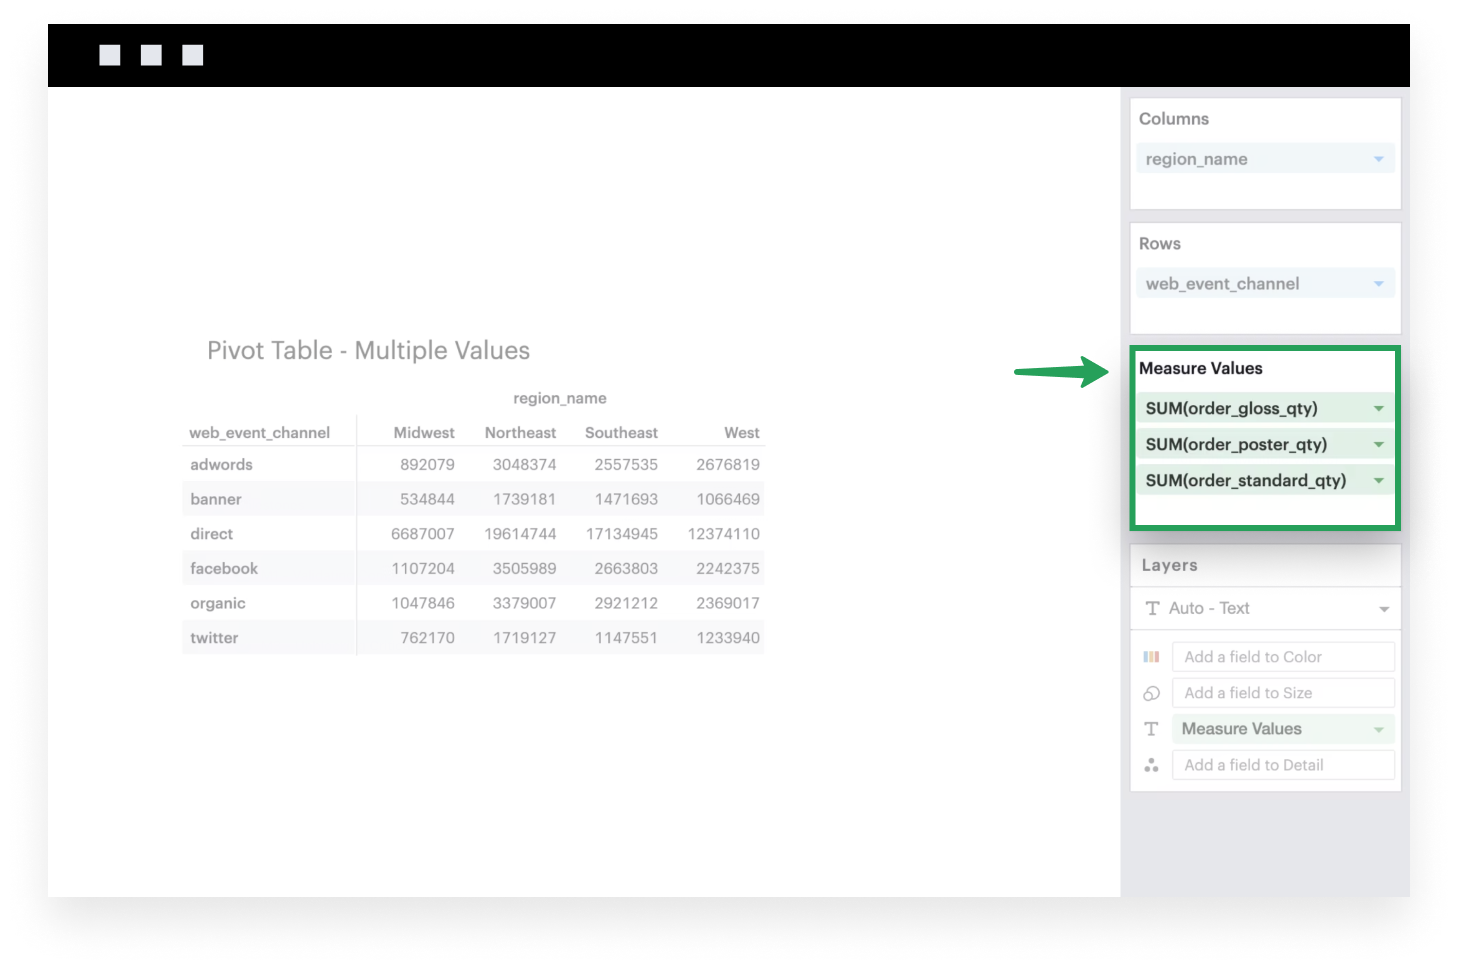
Now you can add as many continuous, aggregated values as you’d like in the Measure Values shelf.
-
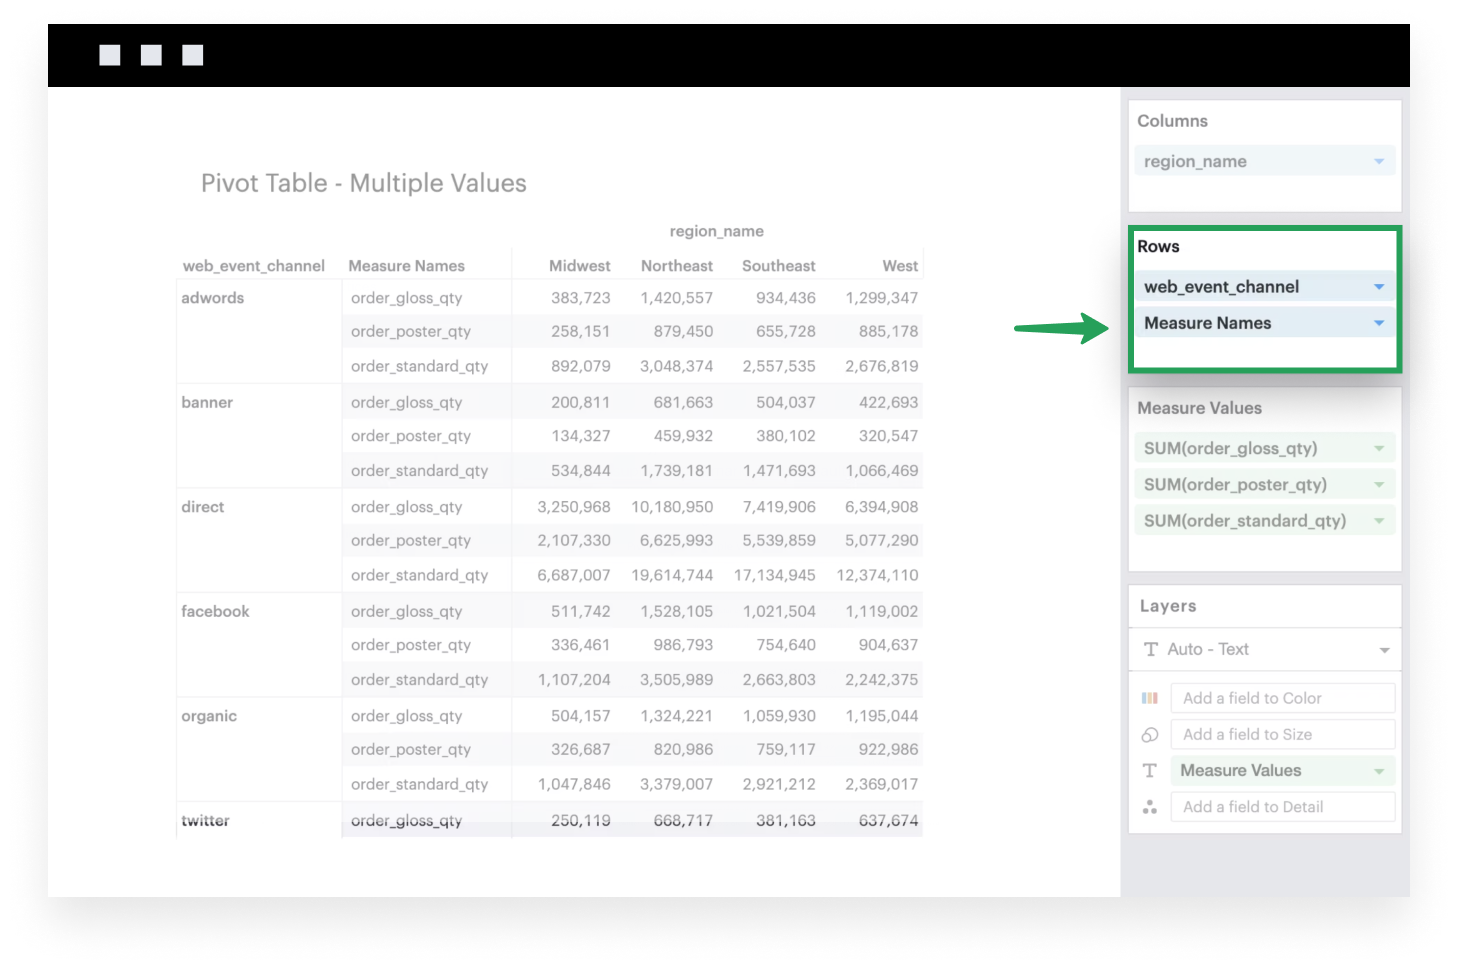
Lastly, add Measure Names to either Rows or Columns. Each cell currently only supports one mark, so by default the values are drawn on top of each other; adding Measure Names will ensure that each field in your Measure Values shelf is now its own group.