Aggregation formulas
When working with formulas, it is useful to understand the difference between regular (or row-wise) formulas and aggregation formulas.
Standard and aggregation formulas
Formulas can be broken down into two types: standard formulas and aggregation or cumulative formulas.
- Standard formulas
-
Act on individual rows and return one result for each row. Standard formulas use functions like:
-
add -
subtract -
multiply -
divide -
contains -
if…then…else
-
- Aggregation/Cumulative formulas
-
Combine rows together, and return a single result for a group of rows. Some examples of functions you find in aggregation formulas are:
-
average -
cumulative_sum -
moving_average -
stddev(standard deviation)
-
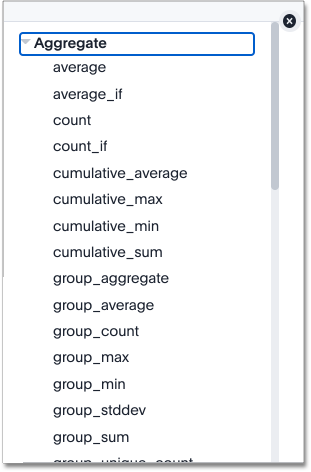
You can tell which formulas are aggregation formulas by looking at the function list when you use the Formula Assistant. Aggregation functions have their own section.

Advanced aggregation functions
Some more advanced aggregation functions are widely used in business intelligence, because they provide better insight into data. Some of the more advanced aggregation functions are:
-
Group aggregation functions apply a specific aggregate to a value, and group the results by an attribute in the data.
-
Cumulative functions measure from the start of your data to the current point. We often use the for time-based data.
-
Moving formulas measure within a window (usually time-based) that you define.
|
Flexible aggregation
The group_aggregate function makes it possible to specify columns and filters to include or ignore in your query.
See Flexible aggregation to learn more about working with this formula.
Using division with aggregation in a search
Whenever your search result combines rows, your formula will get aggregated automatically. For example, if your search contains words like "region", "monthly", or "department", the results will be grouped (aggregated) by that category. The administrator can change the default aggregation that gets applied through a configuration, and you can also change it using the dropdown list in the column header of the search result.
For example, this search would typically return a sum of total sales by department:
sum sales departmentThis search would return an average of sales by month:
average sales monthlyWhen you’re using division in your formula, and the search is aggregated like this, you may have to change the order of operations to get the result you expect. This is best understood by using a real world example.
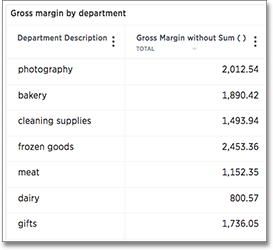
Suppose you want to calculate the gross margin by department for a grocery store. The formula for gross margin is:
profit / salesBut if you use that as your formula, you won’t get the expected calculation. Why? It’s because the formula will be evaluated in this order: For each row, divide profit by sales and then total up all the results. As you can see, the results do not look like gross margin values, which should be between 0 and 1.

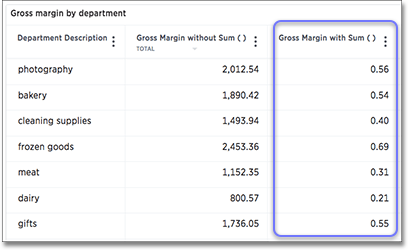
Instead, you’d need to use a formula that uses the order of operations you want:
sum (profit) / sum (sales)Now the result is as expected, because the formula totals the profits for all rows, and then divides that by the total of sales for all rows, returning an average gross margin:

Use aggregate formulas as worksheet filters
Starting in ThoughtSpot release 6.2, you can use an aggregate formula as a worksheet filter.
This is useful when, for example, you only want your results to show a measure when the related attribute is greater than some number, or vice versa.
You may only want to see sales when the unique customer count is greater than 1, or you may only want to see a customer if the associated sales is greater than 0.
Rather than add that formula to every search, you can create a filter at the worksheet level.
To add an aggregated formula to a worksheet, follow these steps:
-
Add the formula to worksheet as a filter, and specify conditions in which it should apply.


