New line column charts
The new line column chart combines the column and line charts. Your search needs at least one attribute and two measures to be represented as a line column chart.
Understand line column charts
Line column charts display multiple measures as a column chart and the multiple others as a line chart. Each of these measures has its own y-axis.
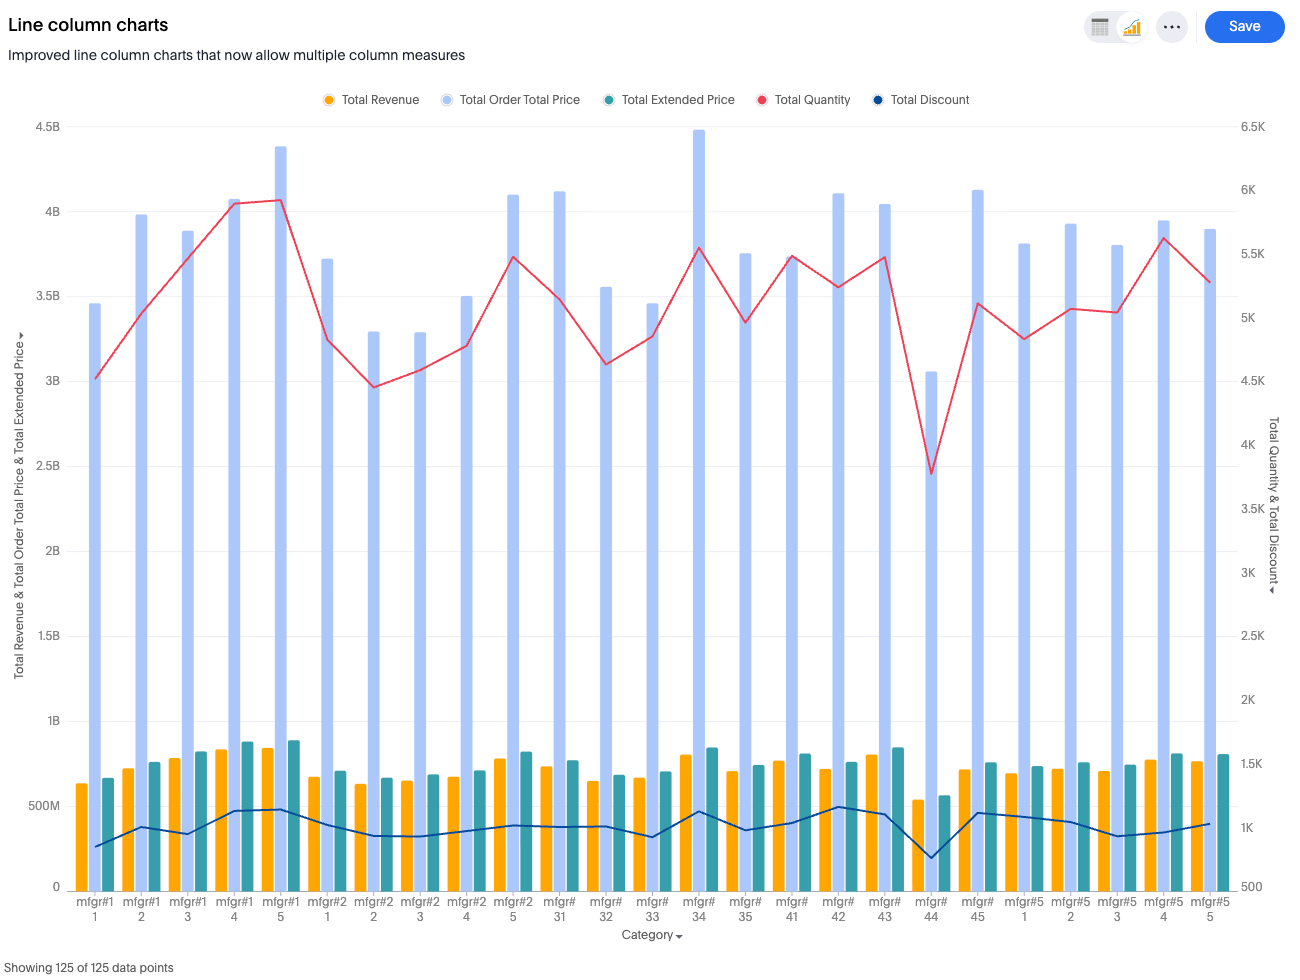
New feature
Ability to choose which measure is visualized as a bar and which is visualized as a line.
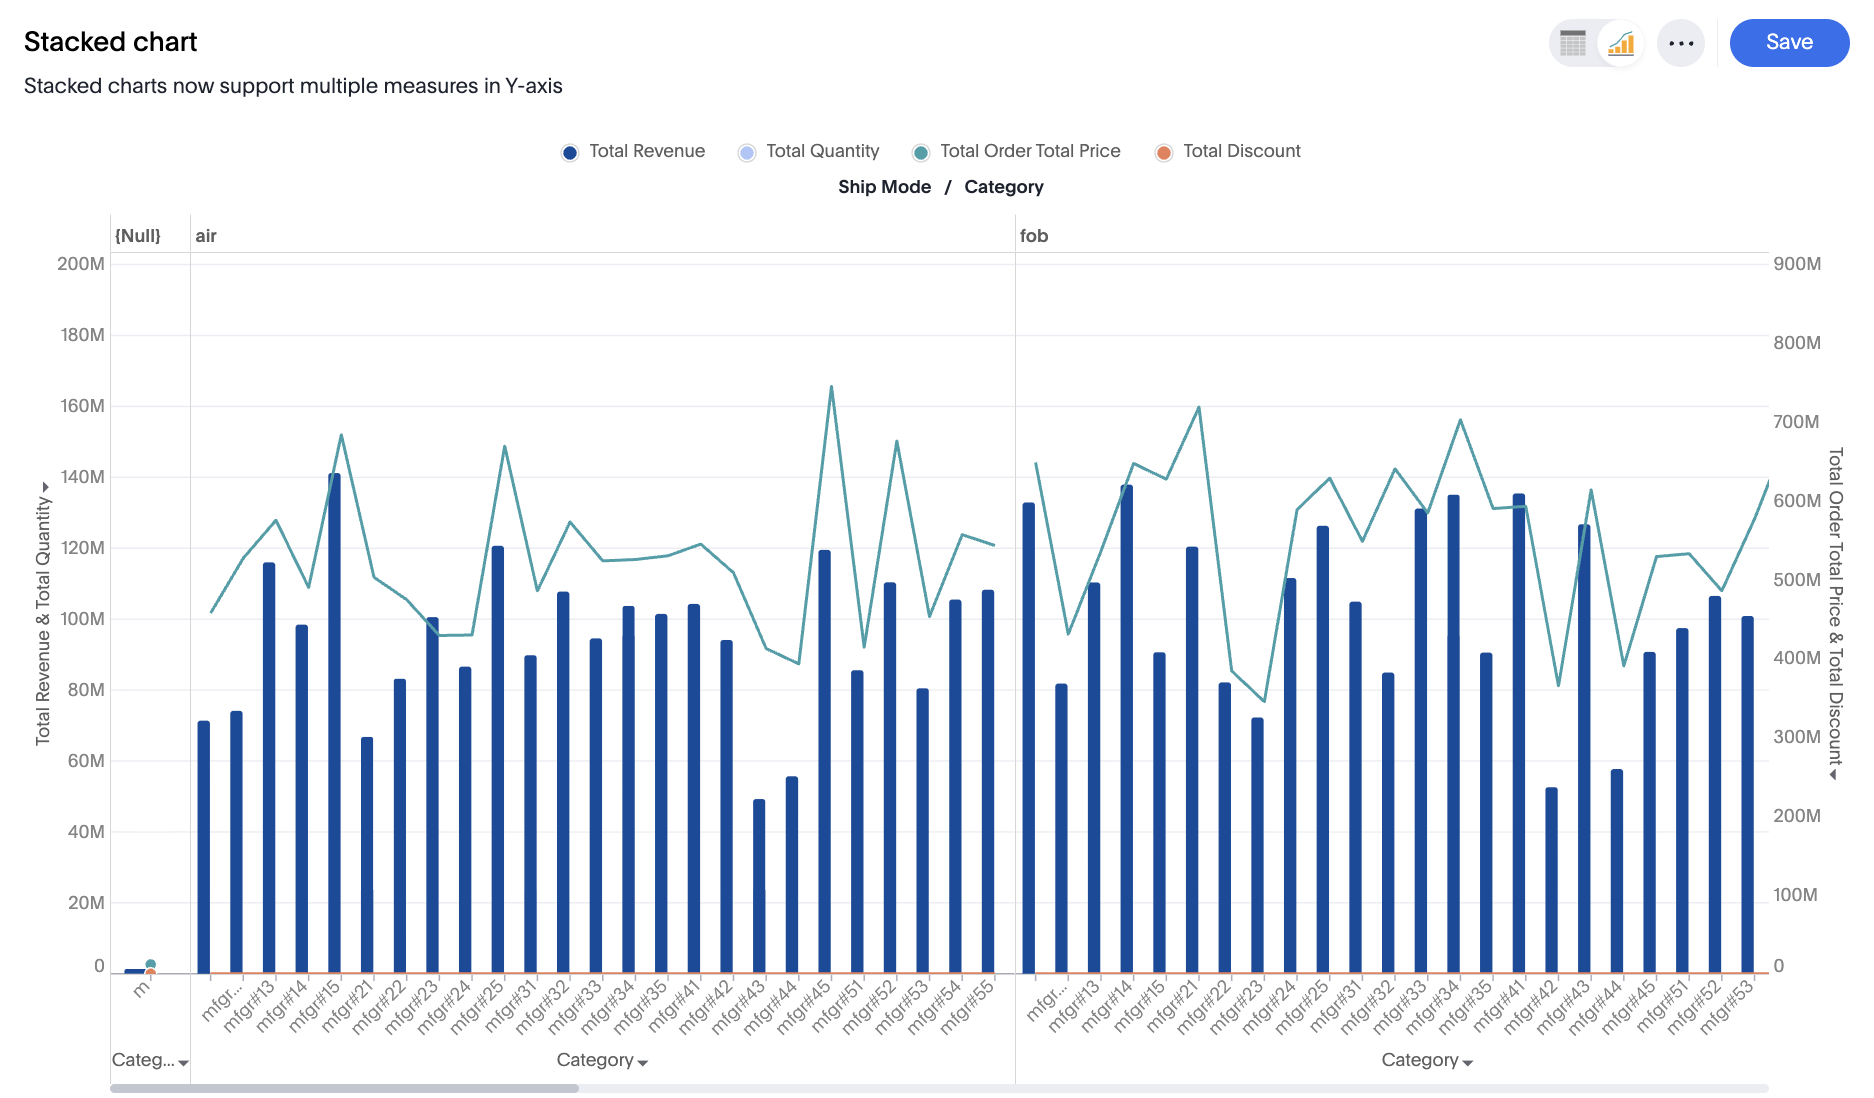
Limitations
-
Dual-axis or multivariate axis transitions are not supported.
-
Slice by color is not supported for line or column layers.
-
Adding a third axis entity is not supported.
-
Removing or emptying either of the two shared axes is not supported.
-
Using an internal dual-axis configuration within either of the main shared axes is not supported.