April 2025 10.8.0.cl
| Features marked as Beta are off by default. To enable them, contact ThoughtSpot support. |
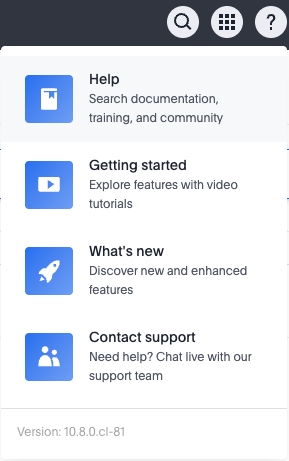
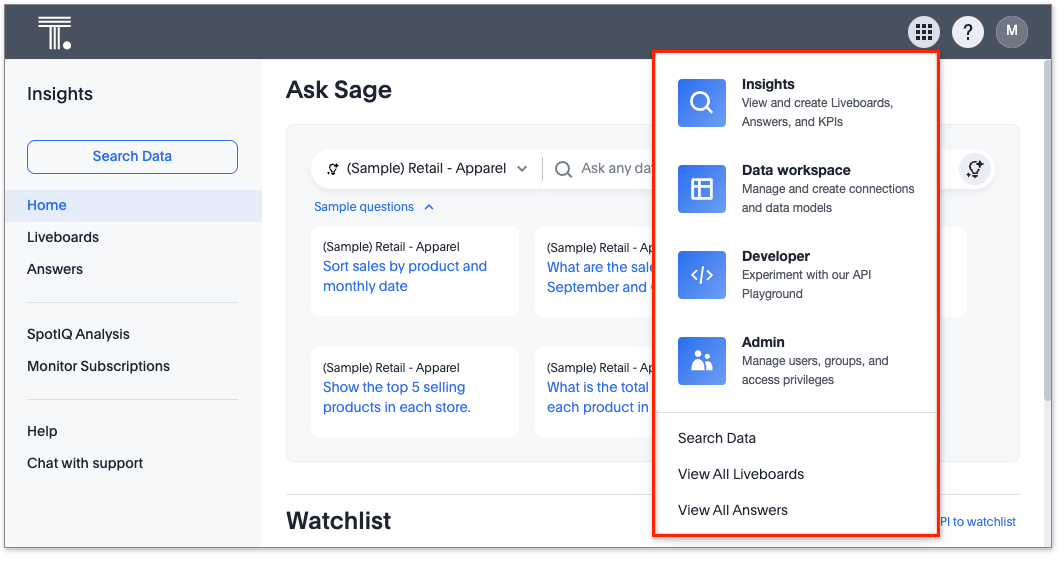
In this release we introduce a unified help and support experience in ThoughtSpot.
To open help and support, click the question mark icon ![]() .
.
Just like the original information center, you can access Help, Getting started, and What’s new. Now, you can also access support, and see the version of ThoughtSpot that you are currently using. The original support icon which appeared in the bottom right corner of ThoughtSpot has been removed.
In addition to these features, your ThoughtSpot administrator can add custom links, which appear under the Contact support menu item.
| We are gradually making this available to customers, so if you don’t see it immediately after your instance is upgraded, it should appear within one month. |
Chat support changes
With support, you can still send a message, book a call with a product specialist, or search for answers in our documentation, training, and community sites, using the help and support menu to open the support window.
| If you currently have your in-product support feature disabled, the Contact support menu option will display Report a problem instead. |
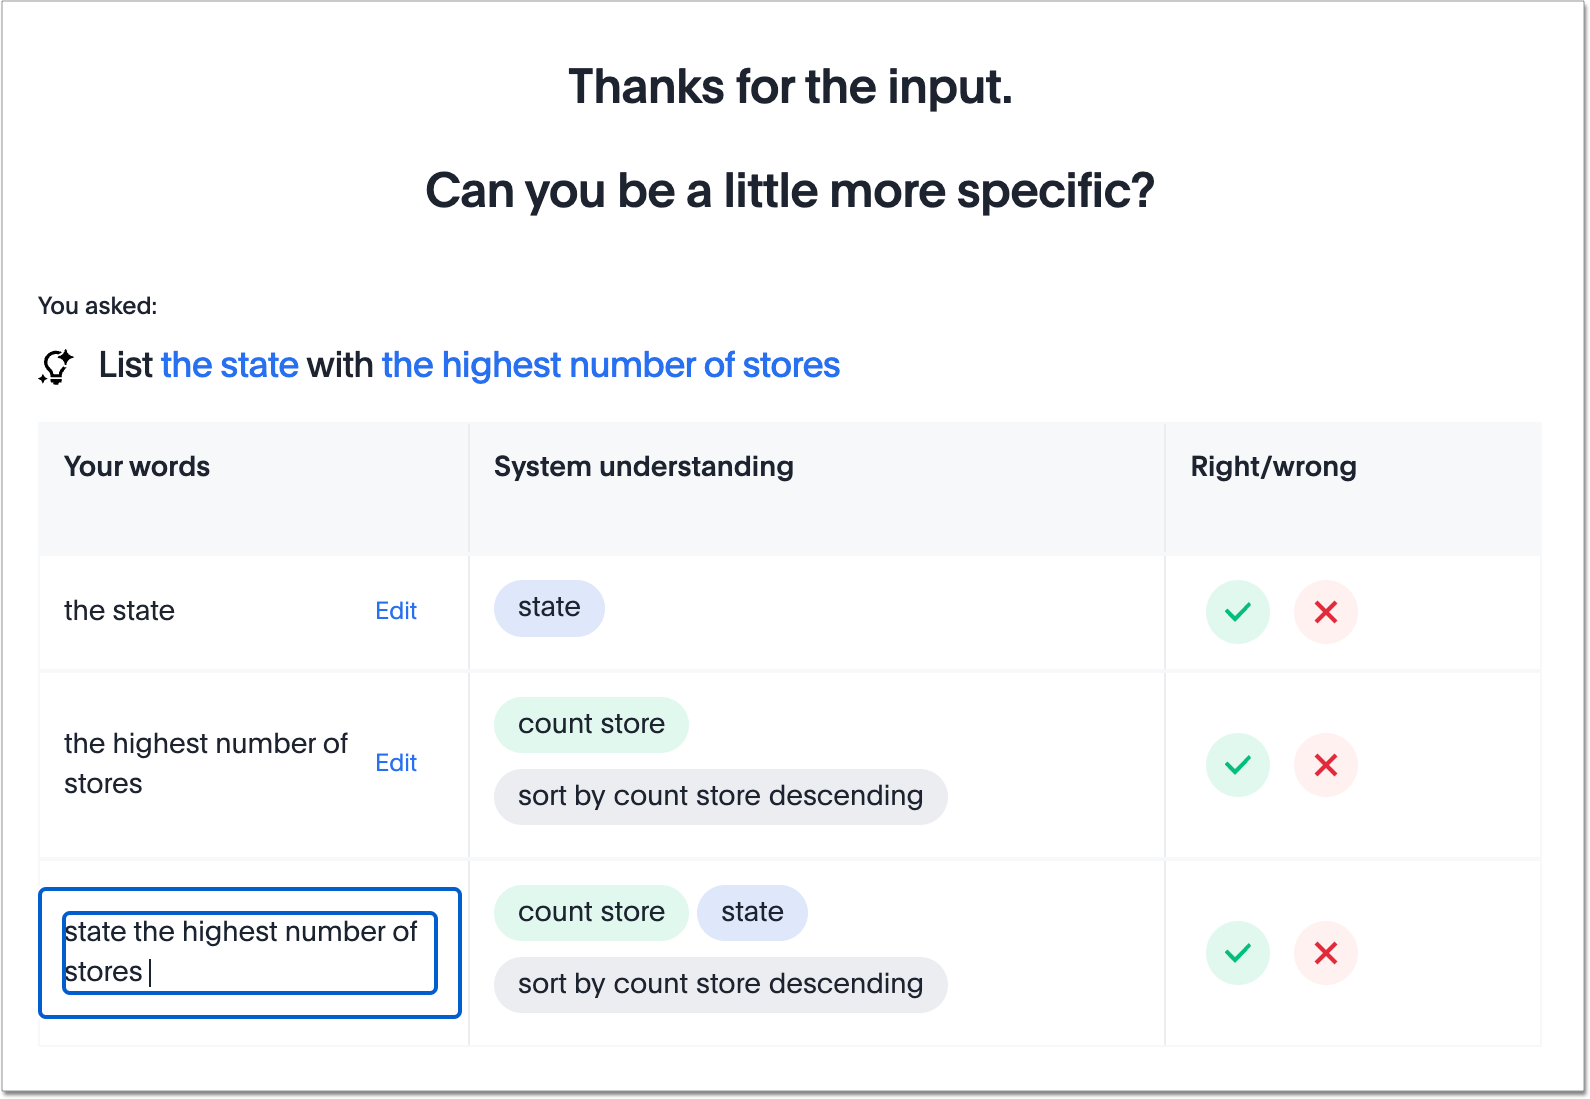
Spotter shortcuts Early Access
ThoughtSpot introduces Spotter shortcuts that allow you to select from existing verified data constructs, including columns, filter values, and search data keywords. These shortcuts allow you to mix natural language and deterministic inputs when using Spotter. To enable this feature, contact ThoughtSpot support.
For more information, see Spotter shortcuts.
Parameters in column names in charts and tables
You can now add a parameter as a variable in the x and y-axis labels and column names of an Answer. When you select a different parameter value in the Answer, previously only the data changed. Now contextual information (such as axis name, column header, and legends) also updates to reflect parameter selected. Any place a parameter is used in Liveboards or Answers automatically displays the current information associated with the selected parameter value. For example, if you have a parameter which contains three possible values (Price, Shipping Cost, and Quantity), when you select Price, the information about the price of items is displayed. When you select Shipping Cost, the information updates to show shipping-related information, and so on.
For more information, see Parameters in axis and column names of charts and tables.
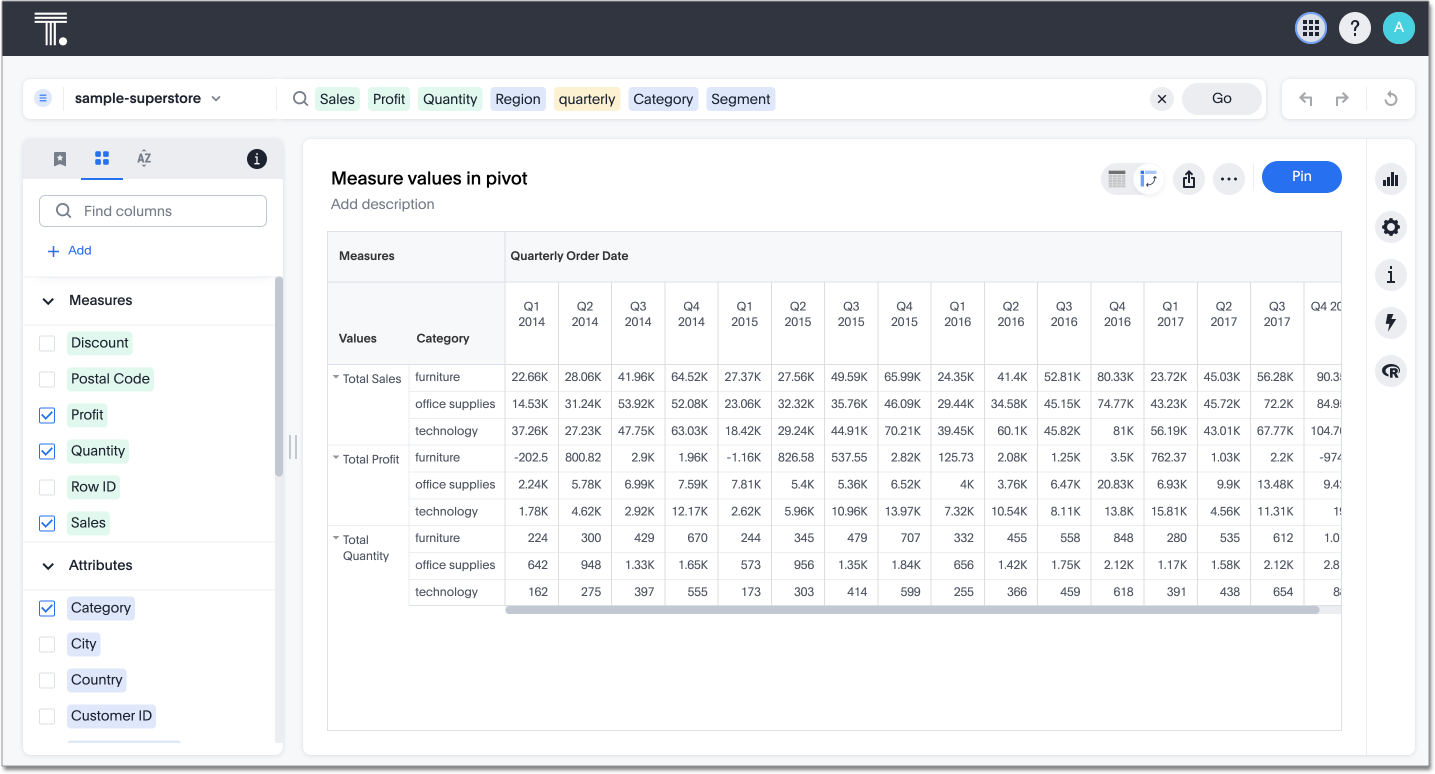
Blended axes in pivot table charts
In this release, we introduce a new way of adding multiple measures to pivot table charts called blended axes. With blended axes, you can group measures and control them through a system-defined chip called Values in the chart configuration settings. This chip acts like an attribute, with the different measures as its unique values. You can also place measures in rows of pivot tables instead of columns. This makes it possible to have more combinations and configurations of charts, including slicing the color for different measures, comparing multiple measures together, and more customizable pivot configurations.
For more information, see Blended axes in a pivot table.
Alerts by attribute Early Access
You can now set KPI alerts to trigger when a selected attribute changes. This can include changes in the value of the attribute, such as an increase in sales by percentage by state, or a scheduled alert to trigger on a weekly basis.
For example, if you wanted to create an alert for a KPI tracking sales of different phones by brand, you could choose the intended brands as attributes and set an alert to be notified when sales for those specific brands dropped by 5%. To enable this feature, contact your administrator.
For more information, see Create an alert by attributes.
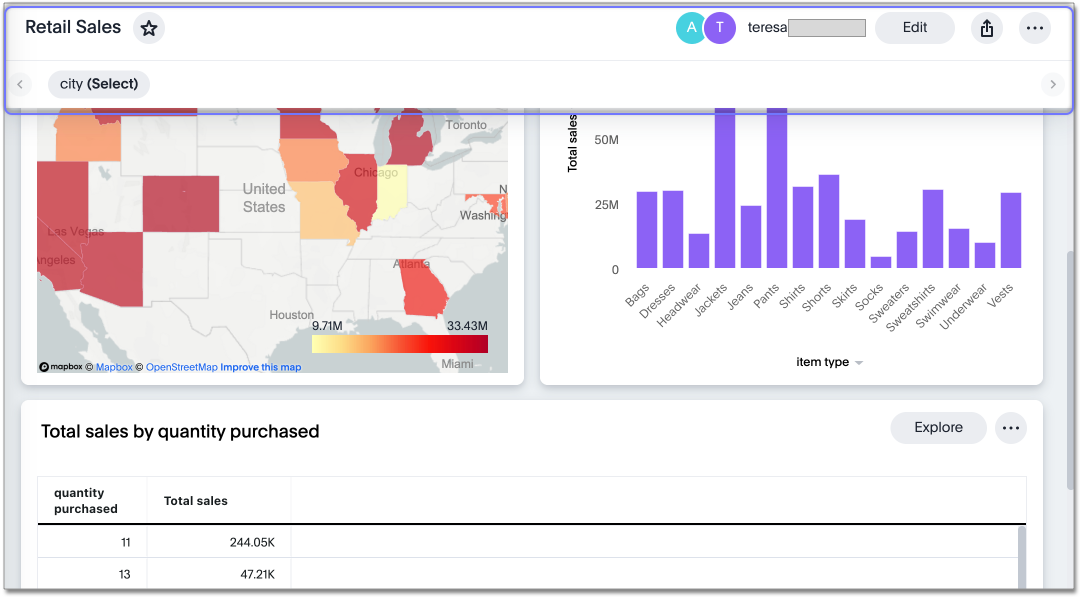
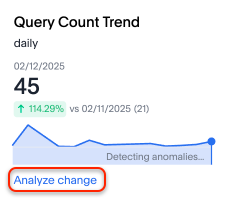
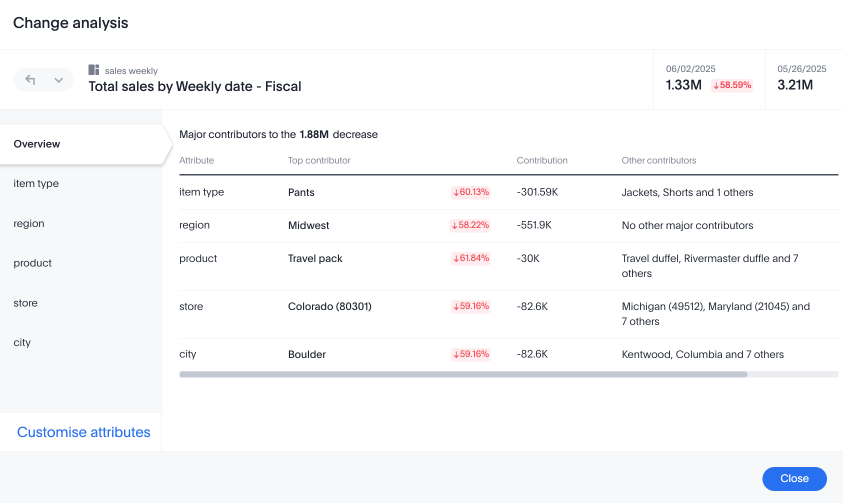
KPI change analysis
The following changes to change analysis for KPI charts are now available to all users and on by default:
-
To open change analysis on a KPI chart, click the Analyze change button at the bottom of the chart.
-
When opening change analysis on a KPI, users see a summary of all changes.
-
KPI anomalies no longer appear as red points on the sparkline, they are labeled as out of the expected range of values.
For more information, see KPI change analysis.
New languages support
In this release ThoughtSpot supports the following new system languages:
-
English (New Zealand)
Bilingual keywords for Japanese
ThoughtSpot now supports bilingual keywords for the Japanese locale. When your system language is set to Japanese, you can now enter keywords in either English or Japanese while searching.
For more information, see 日本語 Keyword reference.
Currency formatting for Japanese Beta
ThoughtSpot introduces whole number formatting for Japanese Yen (JPY) currency. To enable this feature, contact ThoughtSpot support. For more information, see Set number.
Include or exclude cover and filter pages from a Liveboard PDF Early Access
ThoughtSpot Liveboard PDFs include a cover page and filter pages that contain information about the filters applied. You can now use the PDF Options checkboxes to choose to include or exclude these page when downloading or scheduling a Liveboard PDF. To enable this feature, contact ThoughtSpot support.
For more information, see Download a Liveboard as a PDF.
Number formatting on attributes Beta
ThoughtSpot introduces enhanced number formatting controls for measures that are marked as attributes in the data source. Use this enhanced formatting to ensure that measures marked as attributes are formatted with the appropriate number format.
For more information, see Set number.
To enable this feature, contact ThoughtSpot support.
Other features and enhancements
Override null or empty values with a custom value Beta
ThoughtSpot introduces a feature to override displayed {Null} and {Empty} values with a customizable value. This allows you to define how null data values appear to better meet your organization’s specific needs.
For more information, see How NULL and blank values are displayed.
To enable this feature, contact ThoughtSpot support.
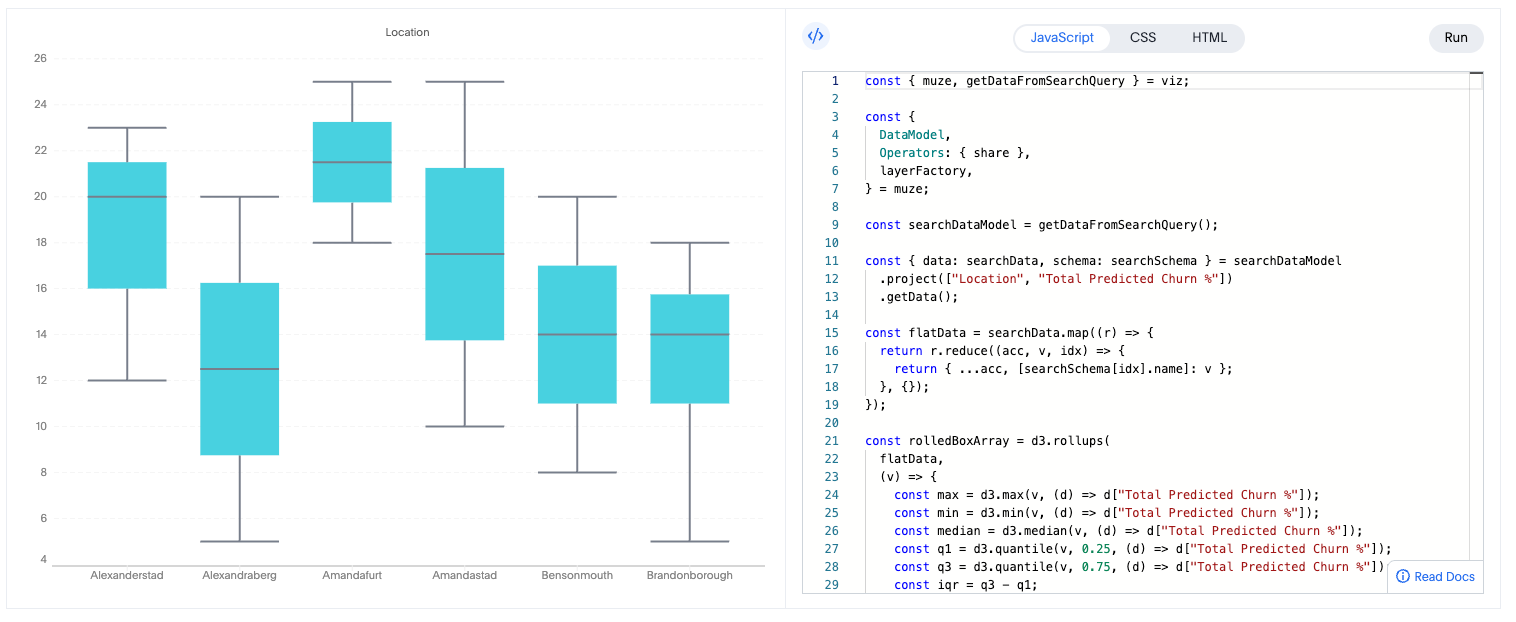
Create your own charts with Muze Studio Beta
You can now create your own charts in ThoughtSpot using the Muze charting library. A developer can create new chart types by writing the code in the code builder. To enable this feature, contact your ThoughtSpot administrator.
For more information, see Creating charts with Muze Studio.
For more information, see Creating charts with Muze Studio.
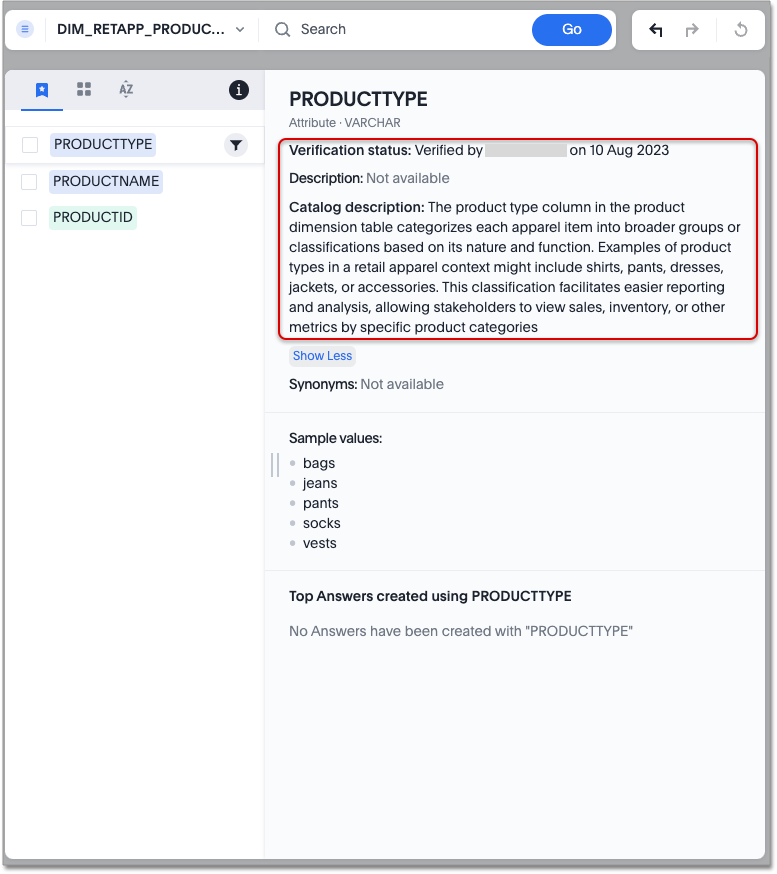
Model knowledge cards
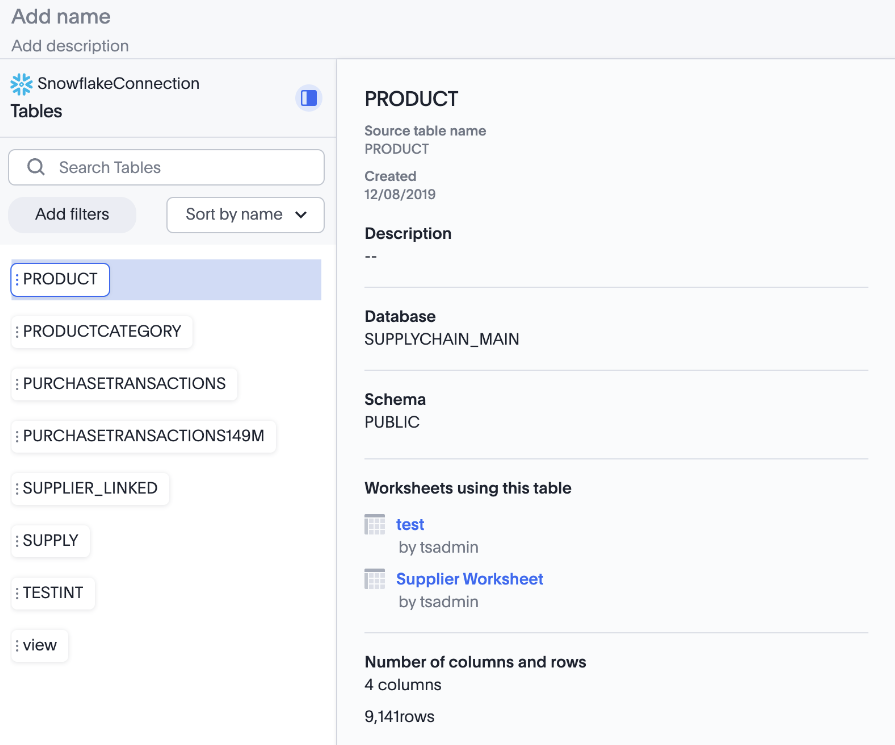
Model knowledge cards are now available to all users and on by default. With knowledge cards, you can now see more detail about tables and columns before you add them to a Model. To view the knowledge card, click the knowledge card button ![]() , and then click the table or column. For more information, see
Knowledge cards.
, and then click the table or column. For more information, see
Knowledge cards.
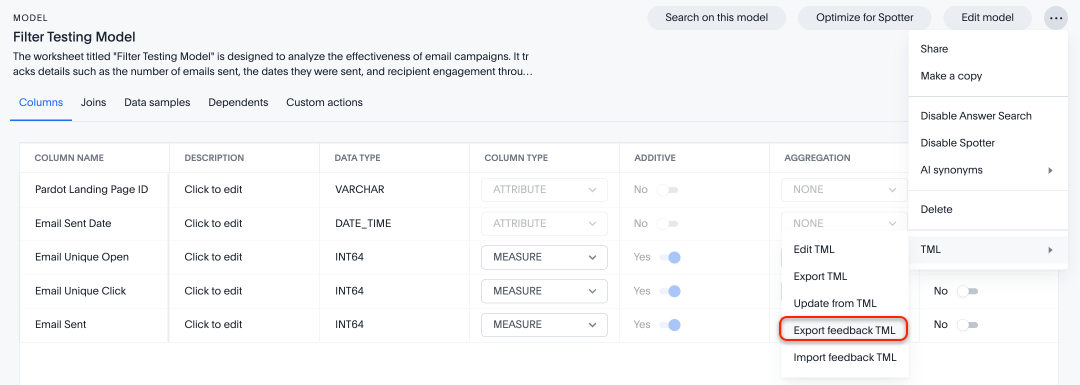
Migrate Spotter feedback using TML
You can now migrate feedback between Models using the feedback TML file. Select the more options icon ![]() on the Model and hover over the TML section to import or export the TML file containing your feedback.
on the Model and hover over the TML section to import or export the TML file containing your feedback.
For more information, see Migrate Spotter feedback using TML and TML for Spotter feedback.
Column name and description aliasing for localization Beta
This feature provides the ability to define a column name or description alias in a Worksheet or Model which allows column names and descriptions to be displayed in a supported system language. When enabled, column names and descriptions in the Search Data and Answer interface display in the system language selected by the user in their ThoughtSpot user profile. To enable this feature, contact ThoughtSpot support.
For more information, see Column and description aliases for localization.
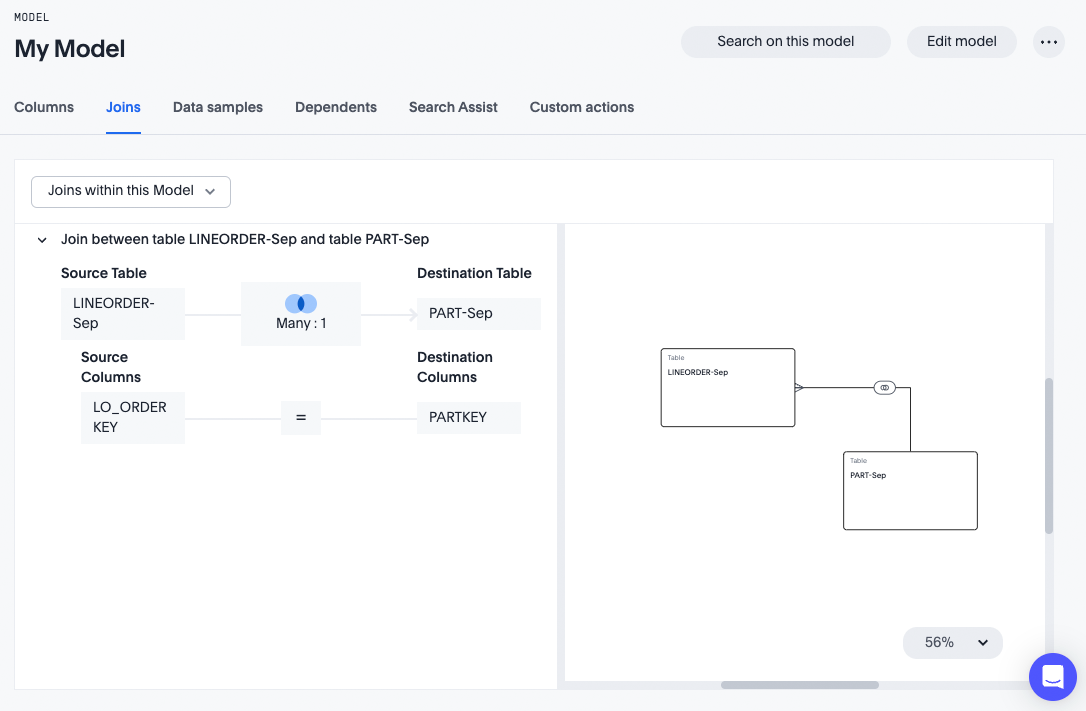
Join cardinality change for global joins
Join cardinality change for global joins is now available to all users and on by default. You can now change the cardinality of a join (1:1, 1:Many, Many:1) without needing to delete and remake the join. For more information, see Change join cardinality.
Natural Language Search queries in Query Stats Worksheet
ThoughtSpot now distinguishes between regular query consumption and Spotter queries within the Query Stats Worksheet. For more information, see System Worksheets.
OAuth for Denodo using Proof Key for Code Exchange (PKCE)
We now support OAuth with PKCE for Denodo.
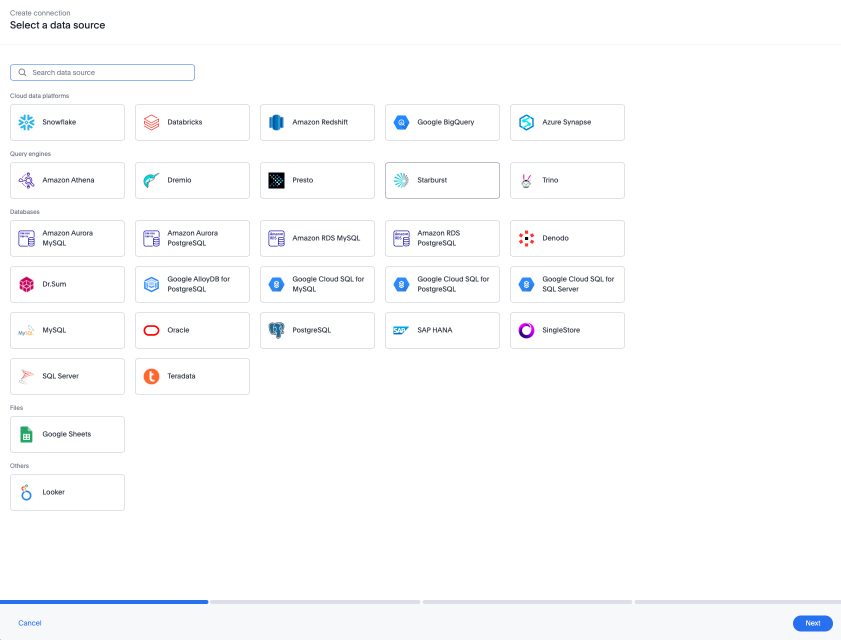
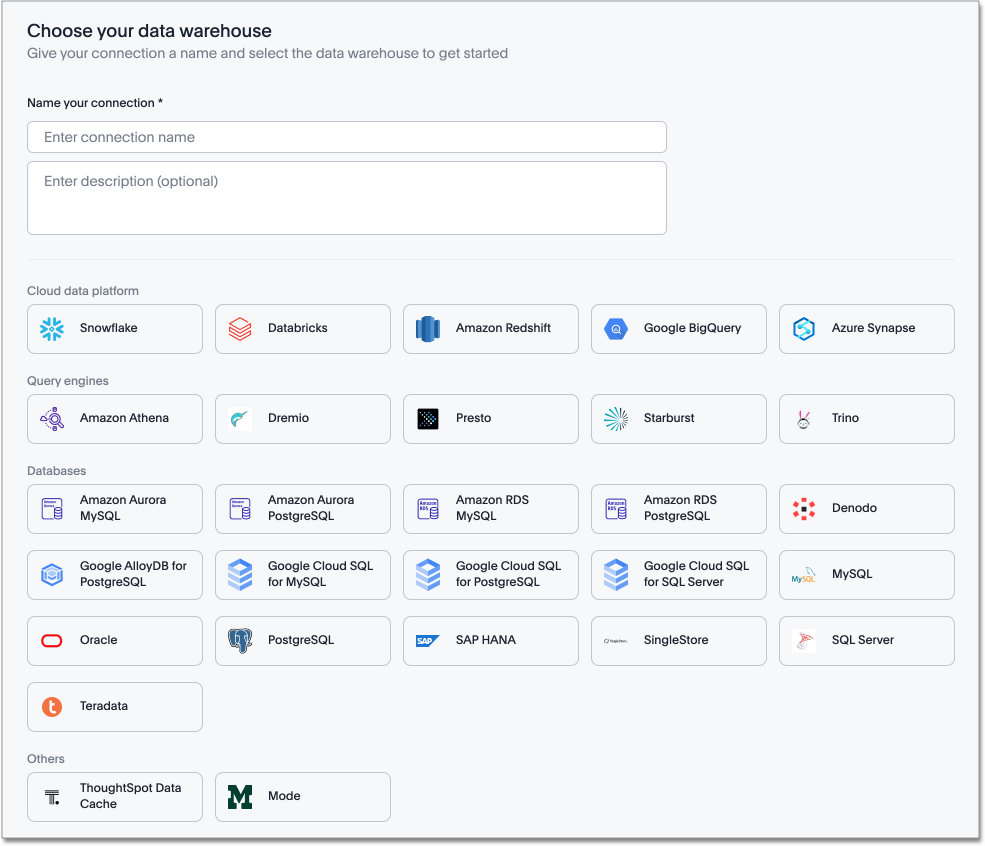
Redesigned Connection creation Early Access
We redesigned and streamlined the process to create a Connection. Set up your Connection in four easy steps by selecting a data source, configuring the Connection, selecting databases, and selecting tables. To enable this feature, contact your administrator.
For more information, see New connection configuration experience.
Bridge support for Oracle, SAP HANA, and SQL Server
Bridge provides options to securely connect your data source with ThoughtSpot Cloud, as an alternative to PrivateLink, VPC Peering, or VPN tunnels. We added support for Bridge for the following connectors:
-
Oracle
-
SAP HANA
-
SQL Server
For more information, see Bridge connectivity for Cloud Data Warehouses and Databases.
For the Developer
For new features and enhancements introduced in this release of ThoughtSpot Embedded, see ThoughtSpot Developer Documentation.
Deprecated and removed features
For the latest information about features to be deprecated or removed, see Deprecated and removed features.
Previous releases
10.6.0.cl
February 2025 10.6.0.cl
| Features marked as Beta are off by default. To enable them, contact ThoughtSpot support. |
Spotter in Slack Beta
Where previously you could ask questions in natural language in Slack using the ThoughtSpot app, you can now use Spotter to conversationally search your data in Slack. Follow-up questions remain within the same thread, preserving context. Pin a Worksheet or Model to a channel to ensure quick access to data from that Worksheet or Model. To enable this feature, contact ThoughtSpot support.
| Spotter in Slack is not available for GCP and ThoughtSpot Embedded clusters yet. |
For more information, see Spotter in Slack.
Show only relevant filters and parameters on Liveboards Early Access
Filters and parameters that are not relevant to a tab are hidden by default when you open and view a Liveboard. You can choose to view all filters and parameters, including those that are not relevant to the tab, so that you can quickly create a new view or download the Liveboard without having to switch tabs and apply filters individually.
To enable this feature, contact your administrator.
For more information, see Apply filters to specific visualizations or tabs.
Improved sorting, filtering, and export of Answers and Liveboards in the new navigation and homepage experience
In this release, we provide new options for sorting and filtering Answers and Liveboards, as well as the option to export them to TML. These options are available in the home page, as well as the Liveboards and Answers pages of the Insights app in the new navigation and homepage experience. The options include the following:
-
Sorting Answer and Liveboard lists by "last modified"
-
Filtering Liveboards and Answers by All or Yours
-
Exporting selected Answers and Liveboards to TML
To confirm you are using the new navigation and homepage, go to your user profile and make sure Navigation and Homepage is set to New experience. For more information, see Home page.
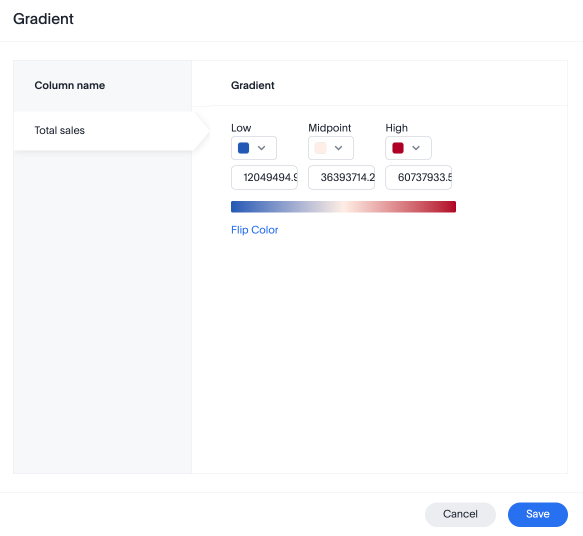
Gradient-based conditional formatting
Gradient-based conditional formatting is now available to all users and on by default. You can now choose multiple colors to define a gradient in charts that support gradients — geo heatmap, geo area, heatmap, and treemap charts. You can control the low, mid, and high values, and numerical value points to customize the gradient.
For more information, see Change chart colors.
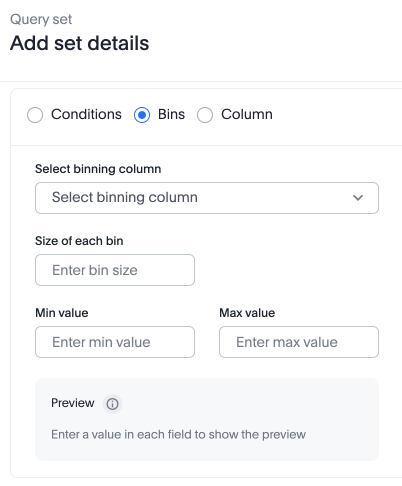
Query set bins Early Access
ThoughtSpot users can now create bins for aggregate results in query sets. This feature allows you to create groups based on bins of specified sizes with minimum and maximum values. To enable this feature, contact your administrator.
For more information, see Query sets.
Passthrough filters for sets Early Access
You can now pass filters from a query into a set definition without needing to remake the set to include the filter. For example, if you create a query set defined as a list of SKUs that are ranked based on sales, where 1 through 10 are defined as Gold, 11 through 50 are defined as Silver, and the remainder are defined as Bronze, you can now add a filter such as Region. You can configure the set’s filter behavior from the TML, instructing ThoughtSpot to exclude or include specific columns, or to accept all filters by default. To enable query sets, contact your administrator.
For more information, see Passthrough filters for query sets.
Advanced conditional formatting
Advanced conditional formatting is now available to all users and on by default.
In addition to using conditional formatting to visually highlight a threshold in a measure (for example, sales > 10000), you can now use conditional formatting to compare a column’s measures to another column.
For example, if you search for sales this year compared to sales last year, you can highlight where sales this year were less than last year. You can set multiple conditional formatting rules to a single table.
For more information, see Advanced conditional formatting.
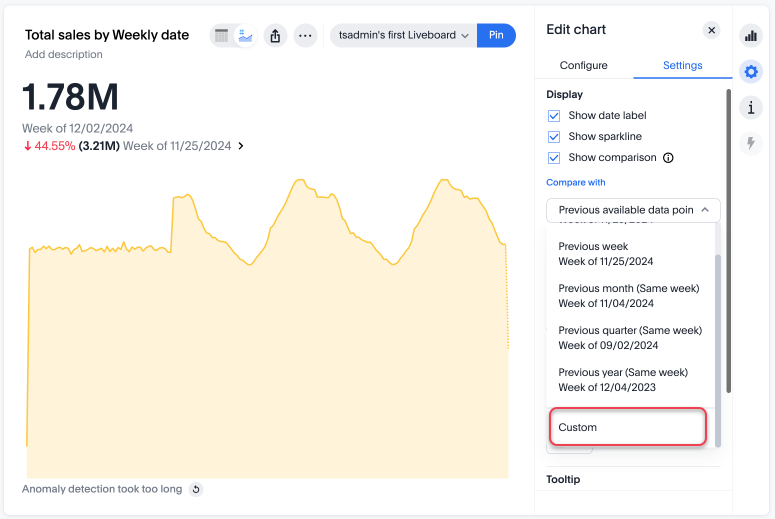
Custom comparison point for KPI charts
Custom comparison points for KPI charts are now on by default and available to all users. Previously, time-series KPI charts had limited options when comparing to past periods. For example, a weekly KPI could be compared against the previous week, the previous month’s same week, the previous quarter’s same week, or the previous year’s same week. Now, you can set a custom point in data against which ThoughtSpot compares the most recent data point, any number of weeks ago. This feature is applicable to all KPIs including time keywords like weekly, monthly, or quarterly. Your chosen comparison point persists for all viewers of the KPI. To enable this feature, contact your administrator.
For more information, see KPI charts.
KPI change analysis
We made the following changes to change analysis for KPI charts:
-
To open change analysis on a KPI chart, click the Analyze change button at the bottom of the chart.
-
When opening change analysis on a KPI, users see a summary of all changes.
-
KPI anomalies no longer appear as red points on the sparkline, they are labeled as out of the expected range of values. To enable these changes, contact ThoughtSpot support.
Reorder parameters in Liveboards and Answers Early Access
You can now reorder the parameters in Liveboards and Answers, in the same way that you can reorder filters. When you edit a Liveboard or Answer to reorder the parameters and save your changes, the new order is reflected when anyone opens the Liveboard or Answer.
To enable this feature, contact your administrator.
For more information, see Reorder parameters in Liveboards and Answers.
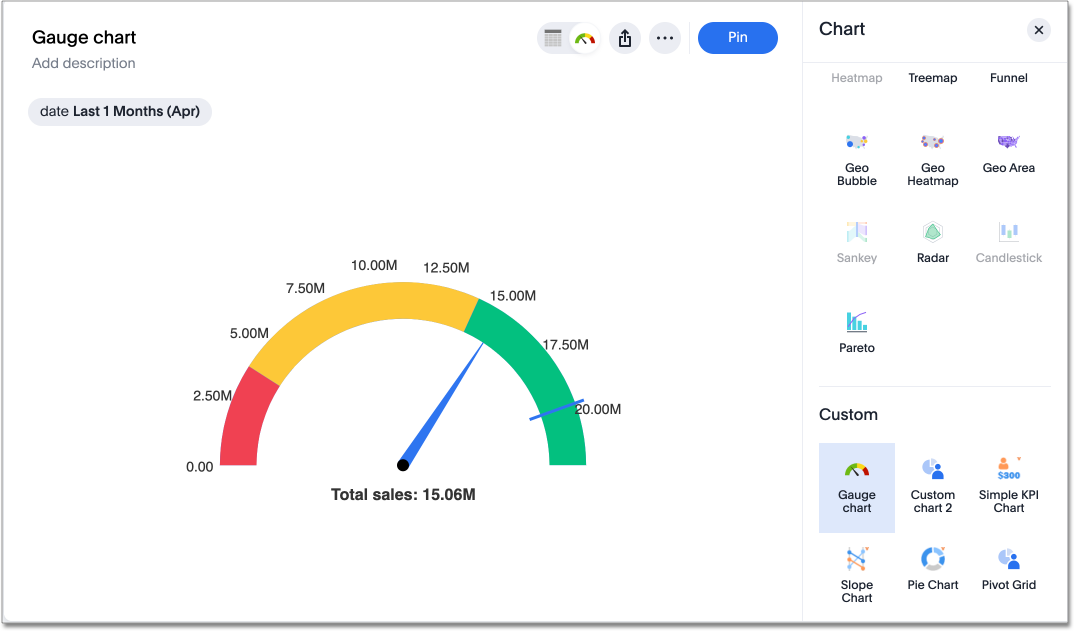
Custom charts
Custom charts are now available to all users and on by default. Custom charts allow you to use charts created outside of ThoughtSpot, including from third-party chart libraries. For more information, see Custom charts.
Pivot table charts Early Access
ThoughtSpot introduces a brand new pivot table chart. The new pivot table charts have the following features:
-
Faster load times with pagination.
-
We now support custom sort order.
-
You can now adjust column widths.
-
You can now slice with measures and attributes.
-
You can now use values for more granular control in configurations.
To enable this feature, contact your administrator.
For more information, see Pivot table charts.
Group aggregates in change analysis
You can now run change analysis on queries that contain group aggregate expressions.
ThoughtSpot Connected Slides new features
The ThoughSpot Connected Slides add-on for Google Slides has the following new features:
-
Schedule daily, weekly, or monthly updates of all visualizations in your Google Slides presentation
-
Personalized views and tabs
-
Timestamp to show when a slide was last updated
For more information, see ThoughtSpot Connected Slides.
Other features and enhancements
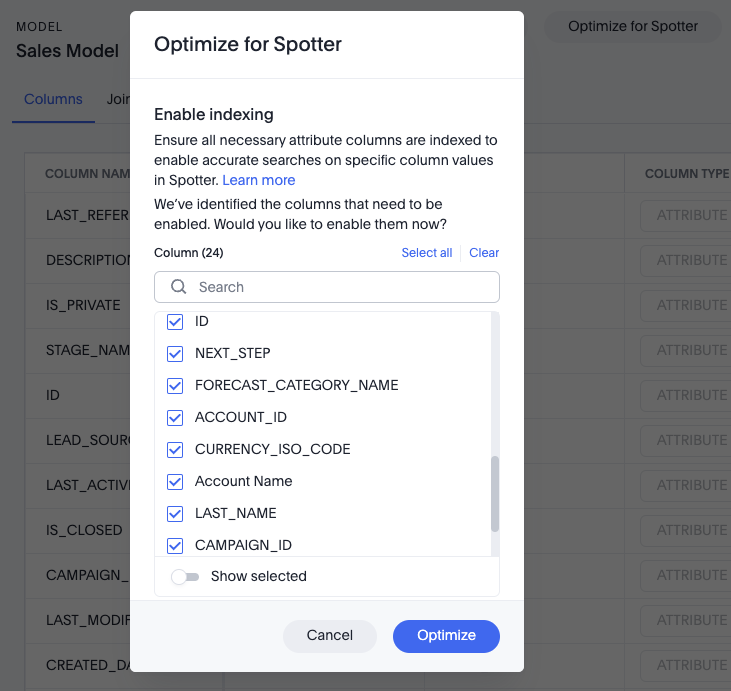
Suggest indexing of columns for Spotter
In this release, we introduce Optimize for Spotter. It is an easier way of indexing the Worksheet and Model attribute columns required for accurate searches on specific column values in Spotter. After enabling Sage on a Worksheet or Model and clicking the Optimize for Spotter button, ThoughtSpot detects which columns are not indexed and allows you to index the ones you need for Spotter. For more information, see Optimize for Spotter.
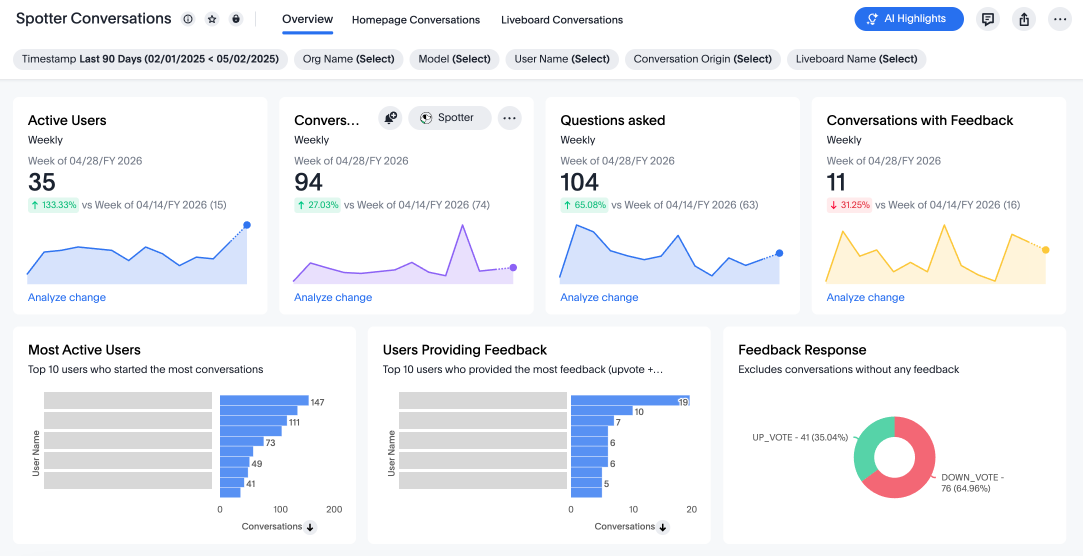
Spotter Conversations Liveboard
We’ve introduced the Spotter Conversations Liveboard to give you real-time visibility into user interactions with Spotter. With this Liveboard, administrators can:
-
Gain insights into user engagement and adoption metrics for Spotter.
-
Track query trends and understand user intent.
-
Monitor follow-up actions, including query refinements and edits within conversations.
-
Analyze feedback to identify training gaps and improve dataset coverage.
For more information, see Spotter Conversations Liveboard.
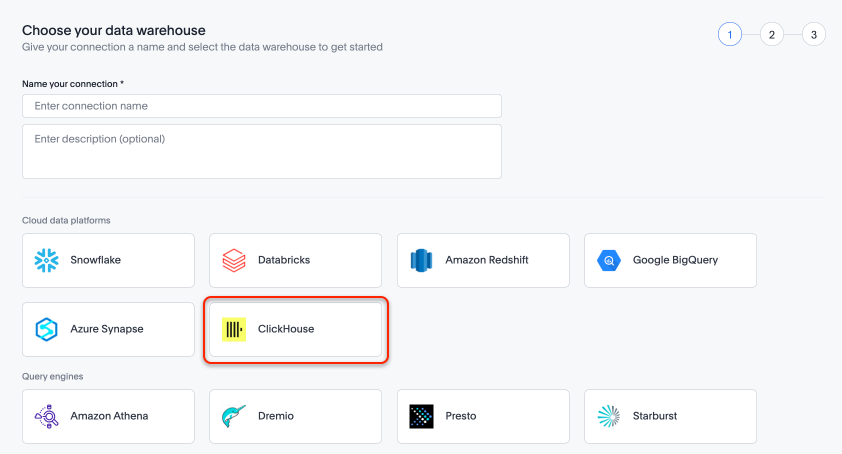
ClickHouse connection Early Access
You can now create connections from ThoughtSpot to ClickHouse. To enable this feature, contact your administrator. For more information, see ClickHouse.
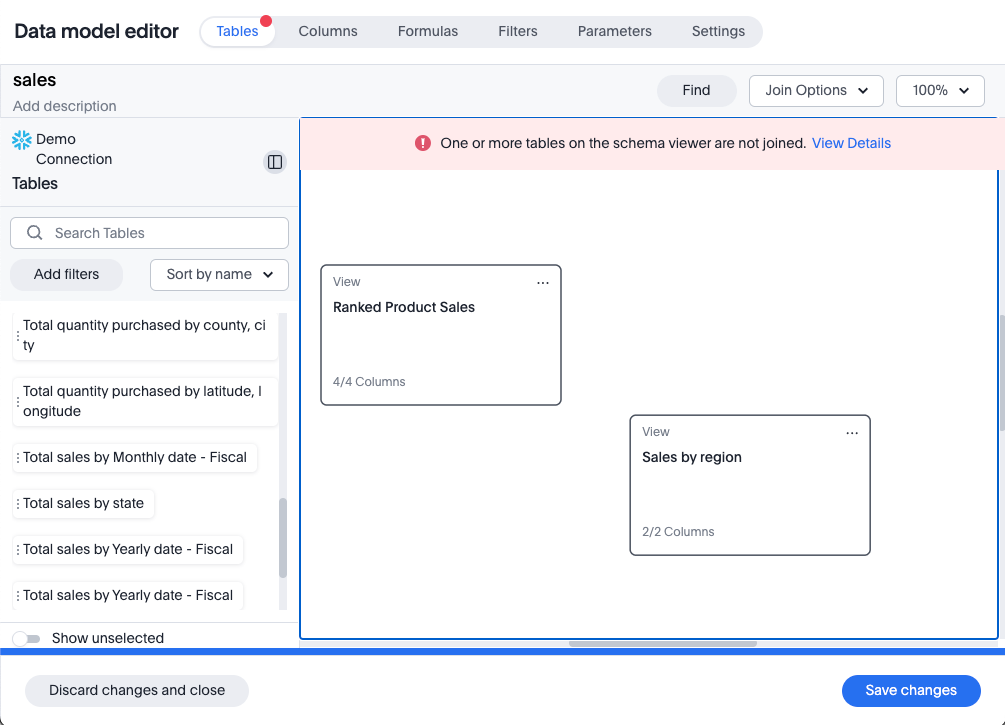
Improved error messaging in Data model editor
The Data model editor has enhanced error messaging to help you understand and fix errors. Global errors, like a session expiring or an error when saving changes, are now displayed in a pop-up window. Local errors, associated with a specific tab, display a red dot on the tab and a banner under the tab after it is selected.
New security log events for data modeling
In this release, we’ve added new security log events for creating, updating, and deleting the following:
-
Tables
-
Imported tables
-
SQL views
-
Worksheets
You can access security logs from ThoughtSpot by pushing the logs to your SIEM server, or by pulling the logs using the Audit Logs API. For more information, see Collect security logs.
User-defined ID in TML Beta
Rather than using a system-generated GUID to identify individual objects in TML files, you can now manually set an object property (obj_id) with a uniqueness constraint on the Org level. This allows you to manage content across multiple Orgs without having to manually change the GUID of an object each time you move it between Orgs. To enable this feature, contact ThoughtSpot support.
For more information, see User-defined ID in TML.
Row count connection configuration Early Access
ThoughtSpot now allows you to assign different configurations when creating a connection, to run row count stats and keep them separate from other process and user queries. Use this feature to help with auditing and tracking your cloud data warehouse usage by user and process. Optimize costs by assigning the right resources to the right process and users.
To enable this feature, contact your administrator.
Import and export users and groups using TML Early Access
Import and export users, groups, roles, and privileges programmatically, using ThoughtSpot Modeling Language. You can use this feature to migrate from one environment to another, and user, group, and role configurations do not need to be recreated. To enable this feature, contact your administrator.
For more information, see Managing users, Managing groups, Understand RBAC and privileges.
Search data mandatory columns Beta
You can now use TML to define a list of associated columns that must be included in a search if a certain column is added. This allows you to make sure users do not remove necessary context from a search by removing a column. To enable this feature, contact ThoughtSpot support.
Multifactor authentication for customers using local authentication Beta
ThoughtSpot now supports multifactor authentication (MFA) for customers using local authentication powered by Enhanced IAM with IAM v2. Use MFA to enable secure access to your ThoughtSpot instance for your local auth users by introducing an additional authentication factor configurable at the cluster level. We support Okta Verify, Google Authenticator, and Email-based time-based one-time passcode (TOTP) authentication with ThoughtSpot MFA.
For more information, see Multifactor authentication for customers using local authentication.
ThoughtSpot Enterprise Org enablement
All ThoughtSpot Enterprise clusters will get enabled with Orgs by default starting with this release. Your environment remains a single-tenant environment until you create an Org. You can delete all the Orgs you created and use only the Primary Org if you want a single-tenant environment with Orgs enabled.
For more information, see Multi-tenancy with Orgs.
Org context for sharing links
ThoughtSpot’s org context for sharing links is now available to all users and enabled by default. URLs in emails now include Org context so that users are taken directly to the correct Liveboard in the correct Org even if they belong to multiple Orgs. You can also move between different browser tabs that point to different Orgs. To enable this feature, contact your administrator.
For more information, see Org context for sharing links.
For the Developer
For new features and enhancements introduced in this release of ThoughtSpot Embedded, see ThoughtSpot Developer Documentation.
10.5.0.cl
December 2024 10.5.0.cl
| Features marked as Beta are off by default. To enable them, contact ThoughtSpot support. |
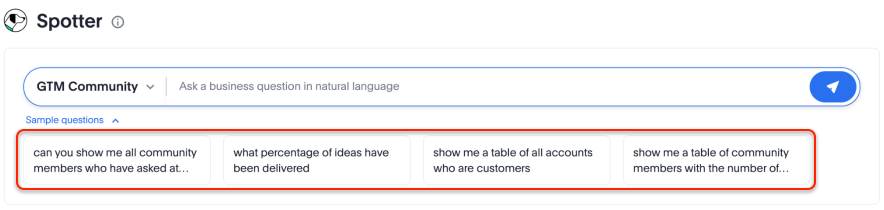
Spotter suggested questions
To increase relevance to your search, Spotter now surfaces past global reference questions as sample questions below the search bar in the home page.
Data update for Google Sheets add-on
With ThoughtSpot Connected Sheets, a free add-on for Google Sheets, you can now update your existing search results to get the latest data without having to enter the search query again. You can do this for the current sheet or all sheets. For details, see ThoughtSpot Connected Sheets.
Anomaly-based alerts
Anomaly-based alerts are now on by default and available to all users. You can receive alerts when data of KPIs you are subscribed to fall outside the predicted value range.
When creating an alert, you can specify the time and frequency at which ThoughtSpot checks the KPI’s data against the values predicted by ML models trained on the data. For example, you can create an alert for a sales weekly KPI, and specify that ThoughtSpot compare the values every Monday at 5 PM. You may also add individual subscribers to the alert. If the KPI’s data falls outside the predicted range, ThoughtSpot sends an alert to your email and, if applicable, your subscribers' emails.
For more information, see Create an anomaly alert.
Change analysis summary tab Beta
Now with change analysis, you get a snapshot view of all the factors/attributes that have changed in a single view, to get an overview of your changes in the chart. You can click View details to see the changes by attribute, or select Customize to change which measures or attributes to analyze.
For more information, see Change analysis summary tab.
Custom comparison point for KPI charts Early Access
Previously, time-series KPI charts had limited options when comparing to past periods. For example, a weekly KPI could be compared against the previous week, the previous month’s same week, the previous quarter’s same week, or the previous year’s same week. Now, you can set a custom point in data against which ThoughtSpot compares the most recent data point, any number of weeks ago. This feature is applicable to all KPIs including time keywords like weekly, monthly, or quarterly. Your chosen comparison point persists for all viewers of the KPI. To enable this feature, contact your administrator.
For more information, see KPI charts.
Query set groups Early Access
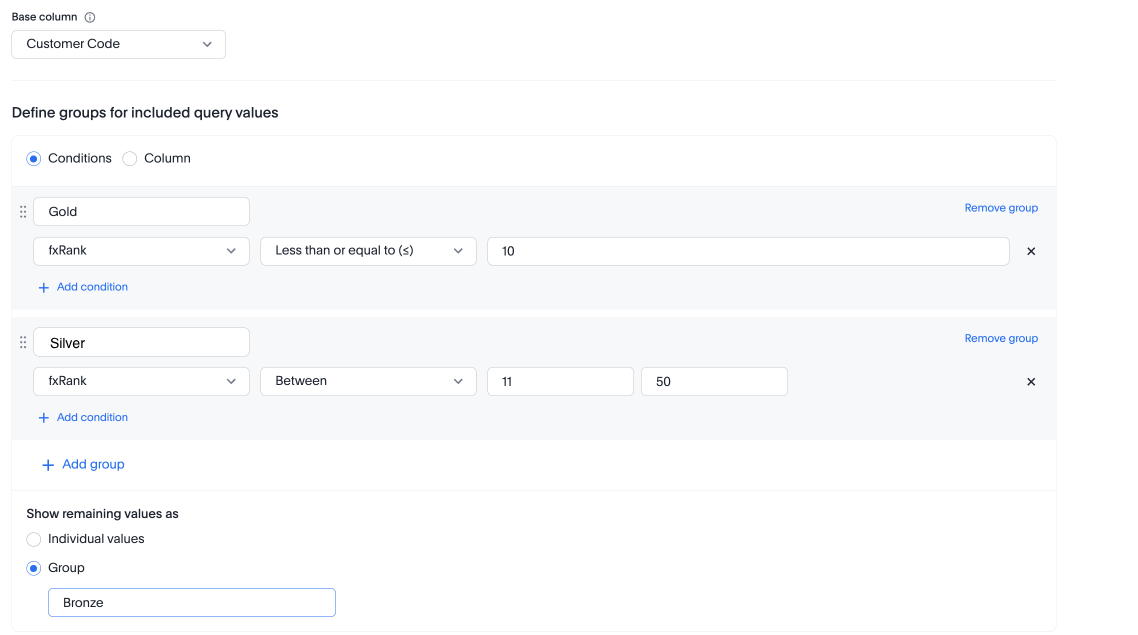
ThoughtSpot users can now define groups for included query values using conditions in Query sets. Conditions allow you to create groups using operators, to specify the parameters of the group.
For example, you could create a query set that list each customer, their sales dollar amount and then add a formula that ranks the amount in descending order. You could then add groups to define GOLD, SILVER, BRONZE levels where Gold is Ranked 1-10, Silver 11-50 and Bronze everyone else.
To enable this feature, contact your administrator. For more information, see Query sets.
Pivot table enhancements Beta
We are introducing a new pivot table chart. To access this feature, contact ThoughtSpot support. This new chart has improvements in the following areas:
-
Performance
-
Faster interaction while expanding rows and columns
-
Pagination
-
-
Customization
-
Custom sort order support
-
Column widths
-
Slicing with measures and attributes
-
Measure names and values
-
-
UX
-
Tooltips
-
Legends
-
Zebra mode
-
Decluttered header space
-
Custom charts Early Access
Custom charts allow you to use charts created outside of ThoughtSpot, including from third-party chart libraries. To enable this feature, contact your administrator.
Compact Liveboard header
We have streamlined the design of Liveboard headers to ensure maximum visibility of Liveboard visualizations no matter the size of the screen. Tabs have been moved to the top line of the header, next to the title.
For more information, see Liveboards.
Other features and enhancements
Databricks service principal with OAuth
You can now authenticate a Databricks connection using a service principal and OAuth secret. For more information, see Add a Databricks connection.
Org switcher display Early Access
Administrators can now enable or disable the display of the org name and Org switcher for users. By default, the org name and switcher are visible to all users. Cluster administrators can modify this setting so that users with only a single org do not see the org name and switcher. For more information, see Orgs administration.
OAuth Connections sign-in for Search Data and Answer view
Admin users now have more control on how users sign in to Connections authenticated using OAuth when the connection authentication has expired. Previously, the Sign in with OAuth button appeared only on Liveboards built on the Connection. Now, users can access the sign-in flow from Search Data and Answers as well. For more information, see OAuth sign-in for Liveboards and Answers.
Join cardinality change for global joins Early Access
You can now change the cardinality of a join (1:1, 1:Many, Many:1) without needing to delete and remake the join. To enable this feature, contact your administrator. For more information, see Change join cardinality.
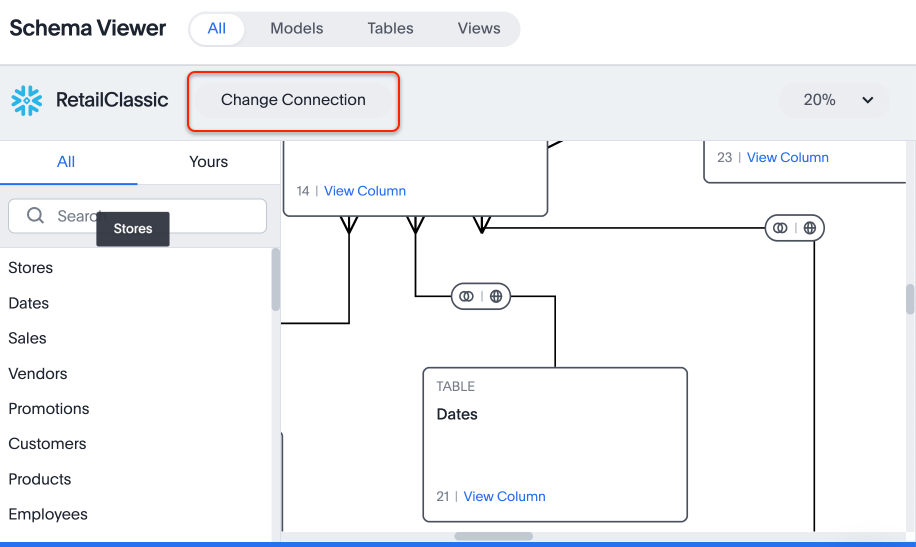
Utilities schema viewer
ThoughtSpot’s schema viewer connection picker is now on by default and available to all users. You can now use the dropdown or search to select your connection in the schema viewer.
| You can no longer view objects across all connections. You must filter by a specific connection. |
For more information, see Schema viewer connection picker.
Administer custom charts Early Access
Administrators can now enable custom charts on the Admin > All Orgs > Early access features page.
For the Developer
For new features and enhancements introduced in this release of ThoughtSpot Embedded, see ThoughtSpot Developer Documentation.
10.4.0.cl
November 2024 10.4.0.cl
| Features marked as Beta are off by default. To enable them, contact ThoughtSpot support. |
Spotter for Cloud
Introducing Spotter, our new AI-powered, unified conversational search experience. This feature replaces the previous Sage search experience. When enabled, you can enter the Spotter interface from the search bar on the Home page, or by clicking Spotter on any visualization pinned to a Liveboard.
You can ask successive questions to hone in on business insights, open a preview of the underlying data, drill down, edit or undo changes to the resulting AI-generated Answers, see what terms Spotter changed from question to question, and submit feedback to train Spotter’s interpretations. Analysts can also coach Spotter on how to interpret certain terms from the Admin page. For more information, see Spotter for Cloud.
Chart visualization enhancements
We made the following changes to visualizations on Liveboards:
-
You can now hover over items in a visualization’s legend to highlight the data that corresponds to that column.
-
You can hover over a truncated legend to see the corresponding column name in a tooltip.
-
We improved the readability for the smallest size of Liveboard visualizations. Now, minimum-sized visualizations display only the chart, omitting the x- and y-axes and labels. You can hover over select data points to see the values.
For more information, see Basic Liveboard usage.
Compact Liveboard header Early Access
We have streamlined the design of Liveboard headers to ensure maximum visibility of Liveboard visualizations no matter the size of the screen. To enable this feature, contact your administrator. For more information, see Liveboards.

Configuring color gradients Early Access
You can now choose multiple colors to define a gradient in charts that support gradients — geo heatmap, geo area, heatmap, and treemap charts. You can control the low, mid, and high values, and numerical value points to customize the gradient. For more information, see Change chart colors.
ThoughtSpot Sync: send full image of Liveboard to Slack Beta
ThoughtSpot introduces the ability for users to choose to export a Liveboard as a PDF or a PNG image when creating a new sync pipeline. PDFs include the complete Liveboard. PNG images are of the first page of the Liveboard. To enable this feature, contact ThoughtSpot support.
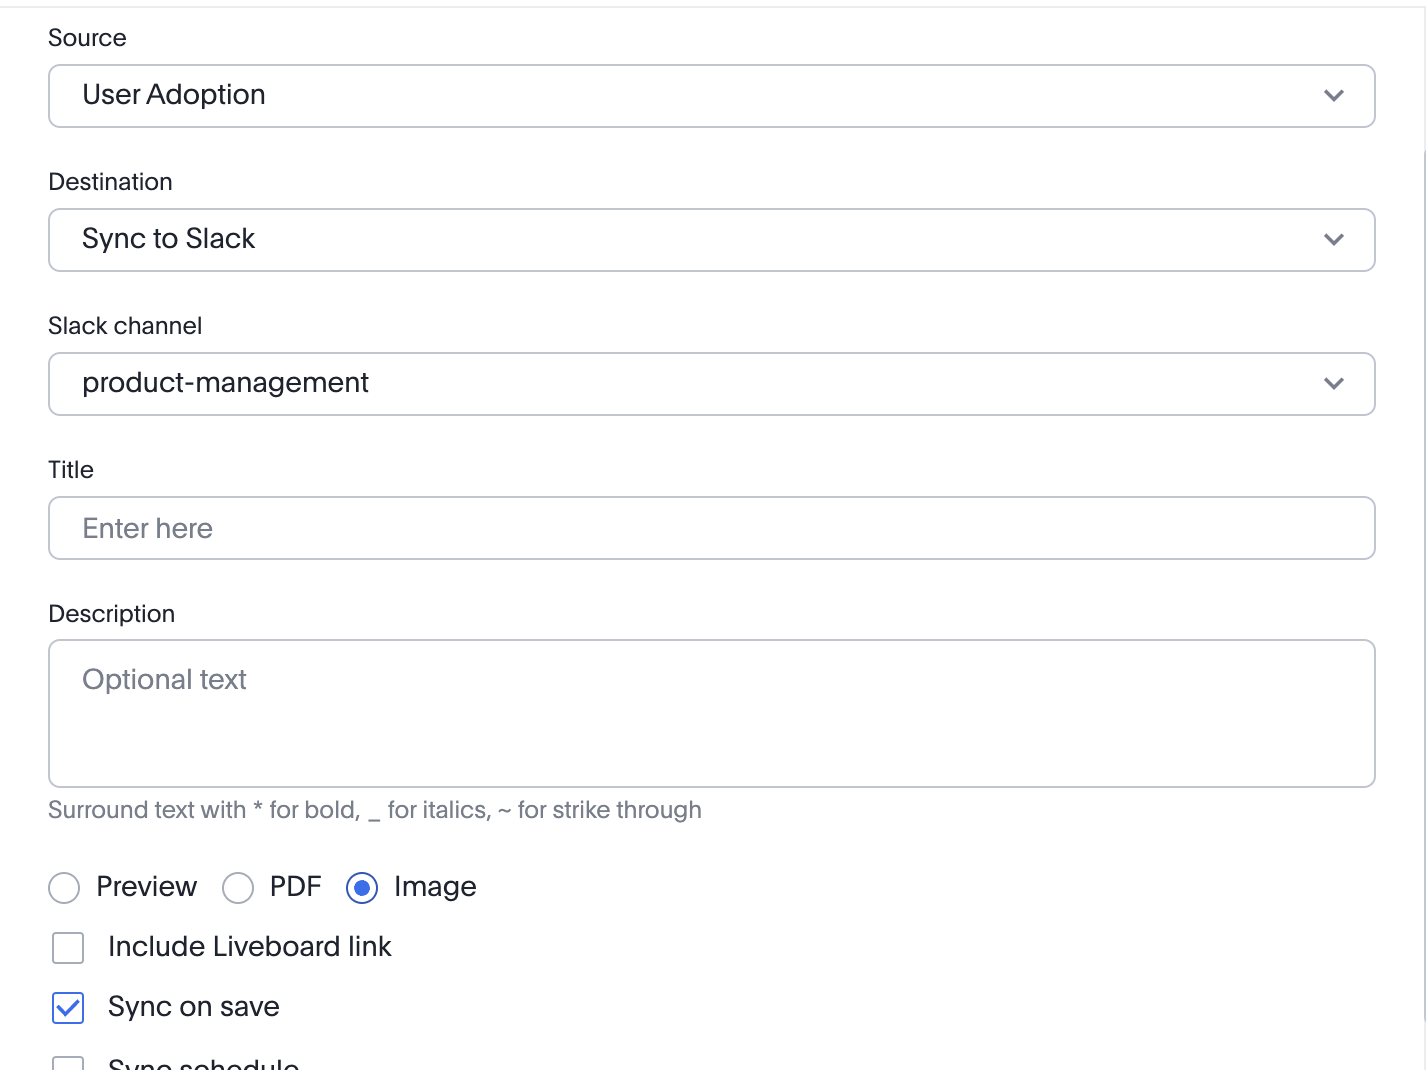
For more information, see Sync data from ThoughtSpot to Slack.
Other features and enhancements
Models
Models are now available to all customers and enabled by default. Worksheets are now deprecated and will be removed in a future release. Existing Worksheets continue to be available and editable, but Worksheet creation is disabled by default. To enable Worksheet creation, you must contact your ThoughtSpot administrator. You can migrate an individual Worksheet to a Model. Bulk migration of Worksheets to Models will be available in the 10.5.0.cl release. For more information, see Models.
Model knowledge cards Early Access
With knowledge cards, you can now see more detail about tables and columns before you add them to a Model. To view the knowledge card, click the knowledge card button ![]() , and then click the table or column. To enable this feature, contact your ThoughtSpot administrator.
For more information, see
Knowledge cards.
, and then click the table or column. To enable this feature, contact your ThoughtSpot administrator.
For more information, see
Knowledge cards.
Updated joins tab for Worksheets and Models
The joins tab for Worksheets and Models is now updated to match the join creation UI for Models.
Control default and available chart types Beta
You can now control the default display mode for Answers (table or chart). You can also decide which chart types are available and default for your cluster. For example, you can set the default chart type for an Answer as a bar chart. You could also decide to remove pie charts from your cluster. To enable this feature, contact ThoughtSpot support. For more information, see Control default and available chart types.
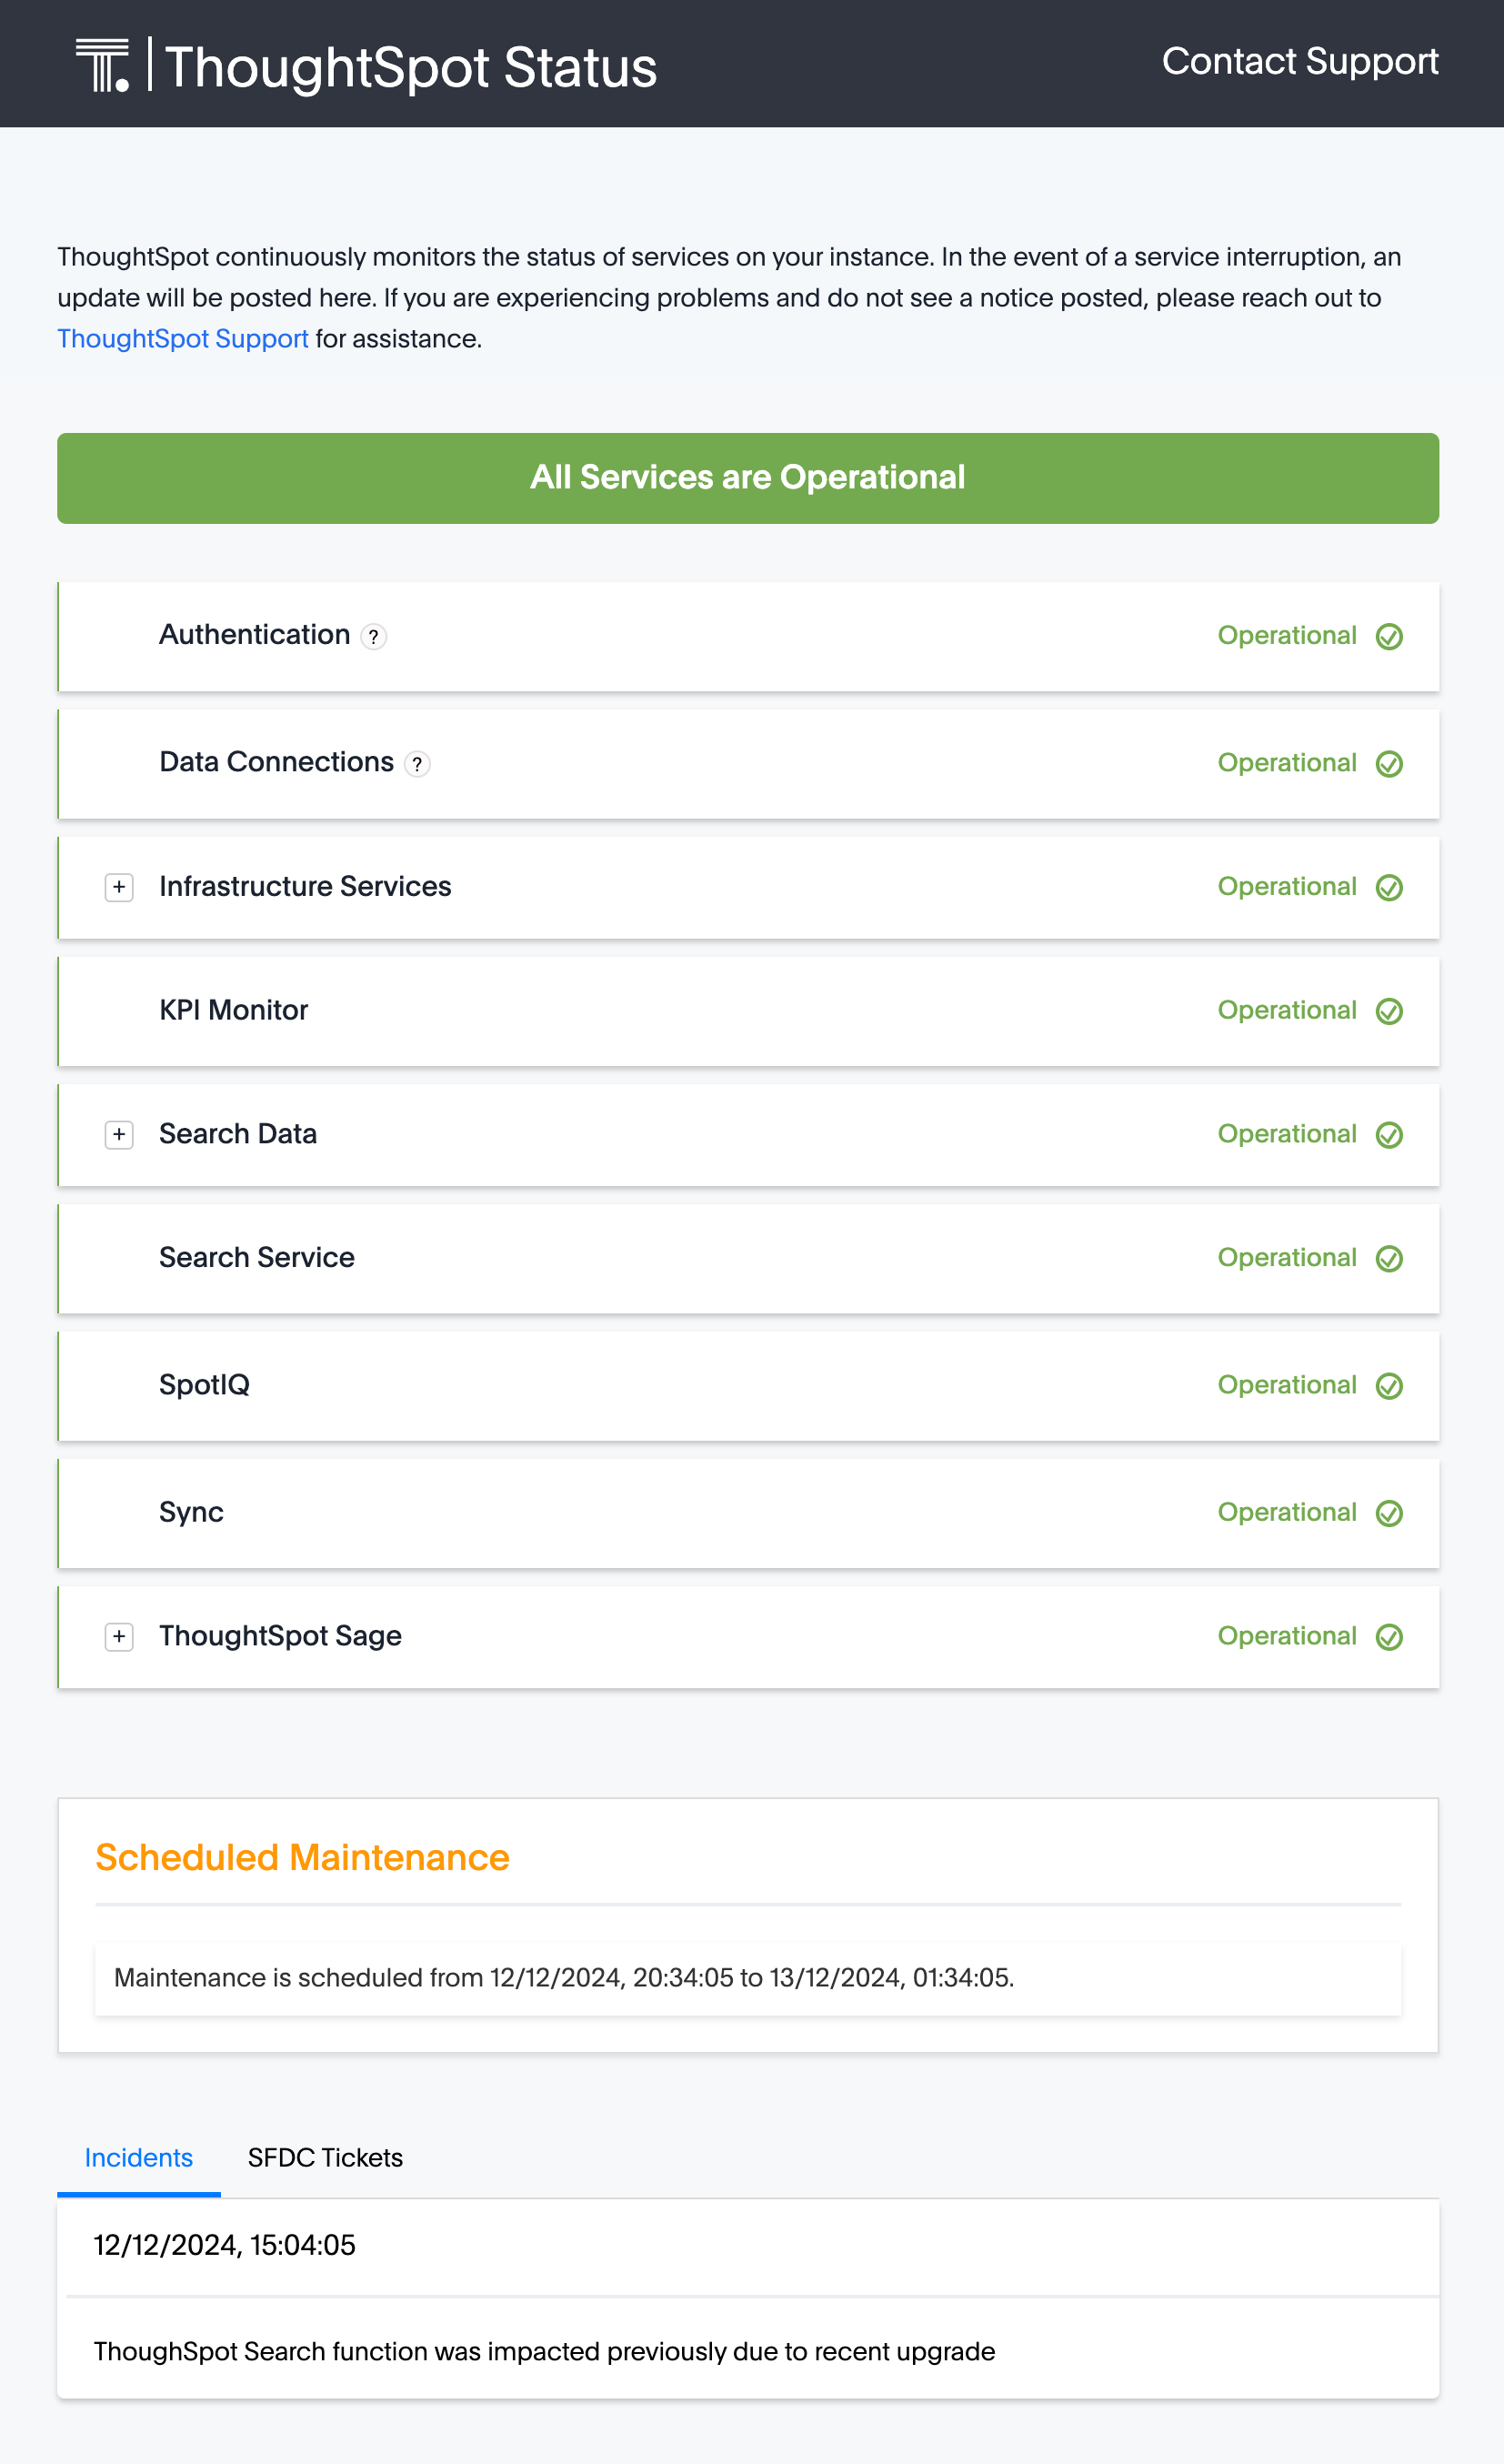
ThoughtSpot Status Beta
Admin users can now navigate to the ThoughtSpot Status page to monitor the health of services on their cluster. The Status page displays the status of different ThoughtSpot services, like Authentication, Data Connections, Infrastructure Services, KPI Monitor, Search Data, Search Service, SpotIQ, Sync, and Spotter. The page also shares scheduled maintenance timelines, outage notifications, and incident reporting and updates.
To access the status page, add /status to the end of your cluster url (for example, https://<clustername>.thoughtspot.cloud/#/status). To enable this feature, contact ThoughtSpot support. For more information, see
Status page.
Version control permissions
We made the following changes to permissions regarding version control:
-
Admin users can now assign the Can set up version control privilege to allow non-admin users to access the version control settings under Admin > Application settings, and to use Version Control REST v2 APIs.
-
We renamed the previous Can manage version control permission to Can toggle version control for objects. Users with this permission and edit access to a ThoughtSpot object can enable or disable version history for that object.
For more information, see Version control for Liveboards and Answers.
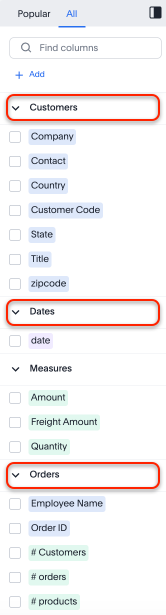
Data panel column groups
Analysts can now set definitions in a Model’s TML file to group columns together in the Data panel for Search Data. You can also use TML properties to enable or disable alphabetical sorting of the groups. For more information, see TML for Models.
Download custom calendar
In the Create a custom calendar interface, you can now set up a template calendar and download it as a CSV file with all columns, based on the values you inputted. You can then modify the file and share it with your ThoughtSpot administrator to upload it to your database. Once the CSV is uploaded to the database, you can set up the calendar by directly mapping the table. For more information, see Create a custom calendar.
Utilities schema viewer connection picker Early Access
ThoughtSpot introduces a connection picker to the schema viewer. You can now use the dropdown or search to select your connection in the schema viewer.
| You can no longer view objects across all connections. You must filter by a specific connection. For more information, see Schema viewer connection picker. |
For the Developer
For new features and enhancements introduced in this release of ThoughtSpot Embedded, see ThoughtSpot Developer Documentation.
10.3.0.cl
October 2024 10.3.0.cl
| Features marked as Beta are off by default. To enable them, contact ThoughtSpot support. |
Natural language search and object search
Natural language search and object search are now separated. To search for an AI-generated answer using natural language, enter your question in the search bar marked Ask a business question in natural language on the home page. To search for related Answers and Liveboards, enter your question in the search bar marked Find existing Answers and Liveboards in the top navigation bar.
For information on the changes in ThoughtSpot Embedded, see Search experience in the ThoughtSpot developer documentation.
For any questions or concerns, contact ThoughtSpot support.
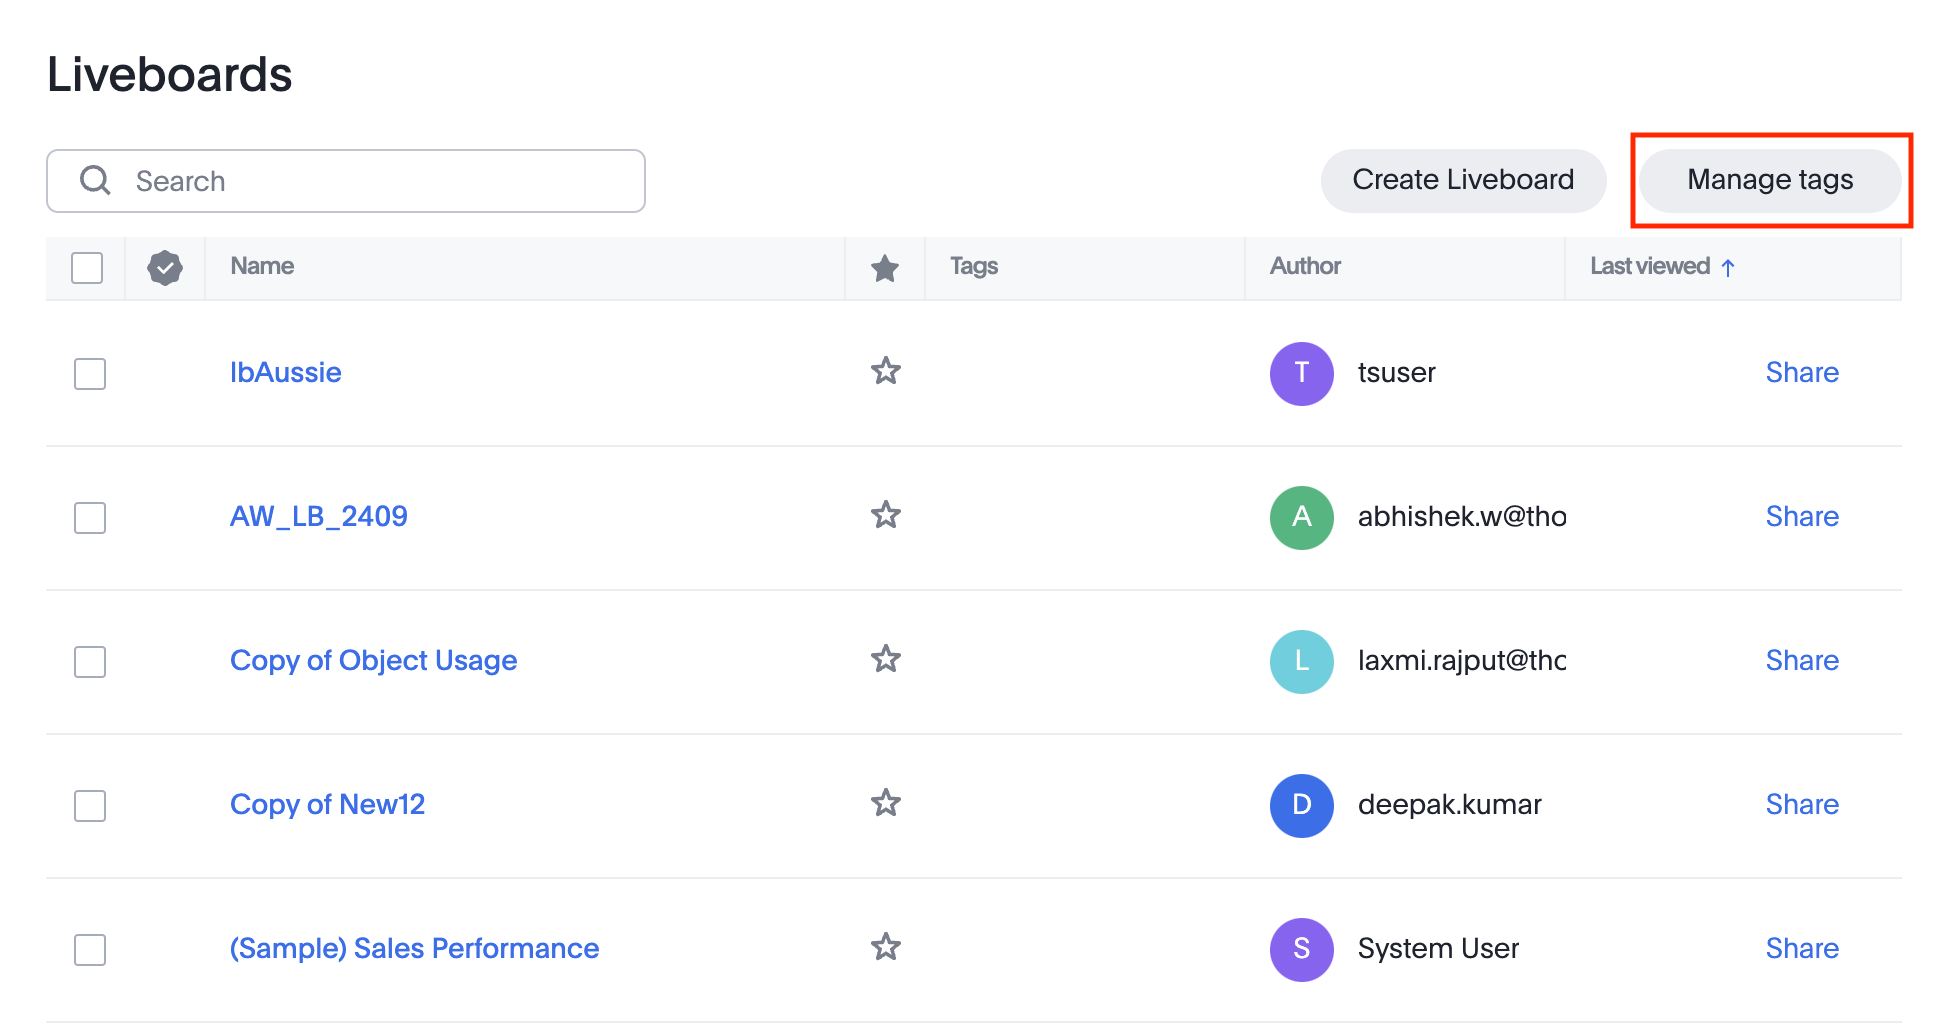
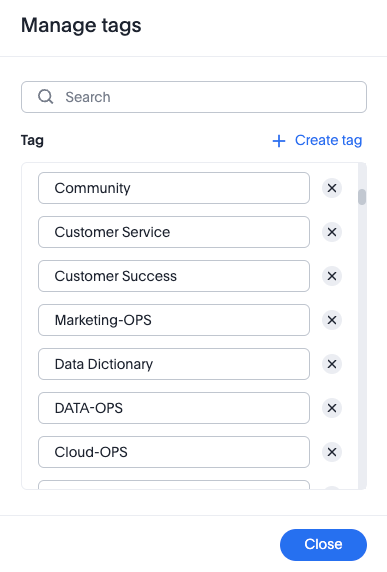
Manage tags for Answers and Liveboards
You can now manage all your Answer and Liveboard tags from one convenient window. Just click the Manage tags button at the top of your list of Liveboards or Answers, then create, edit, and delete tags. To delete and edit tags you must have administrator privileges or the can manage tags role if RBAC is enabled. For more information, see Use tags to organize.
Create an alert from the Watchlist on the home page Early Access
You can now create alerts directly from the Watchlist on the home page.
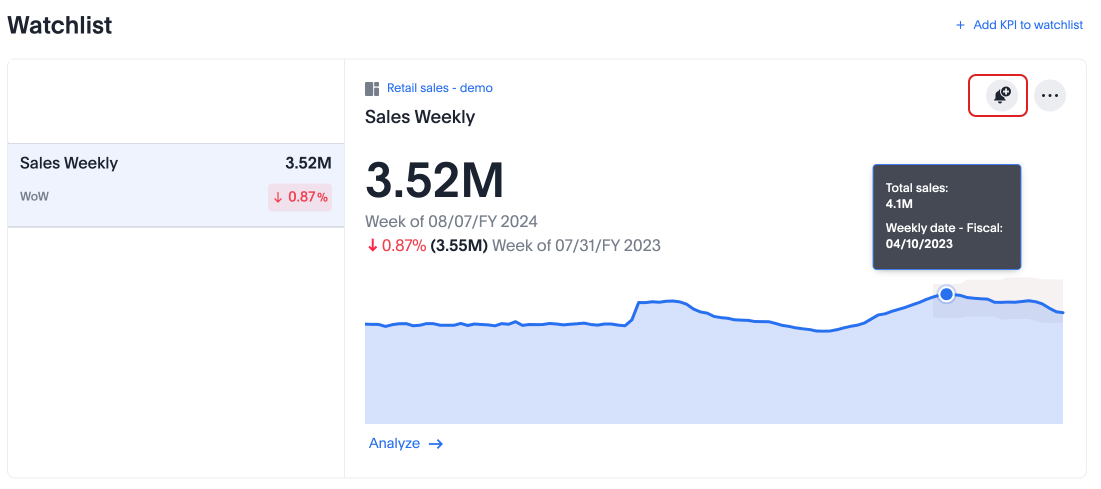
For more information, see Home page and Monitor Key Performance Indicators in your data.
Portuguese (Brazil) keywords
We have updated the Portuguese date keyword synonyms.
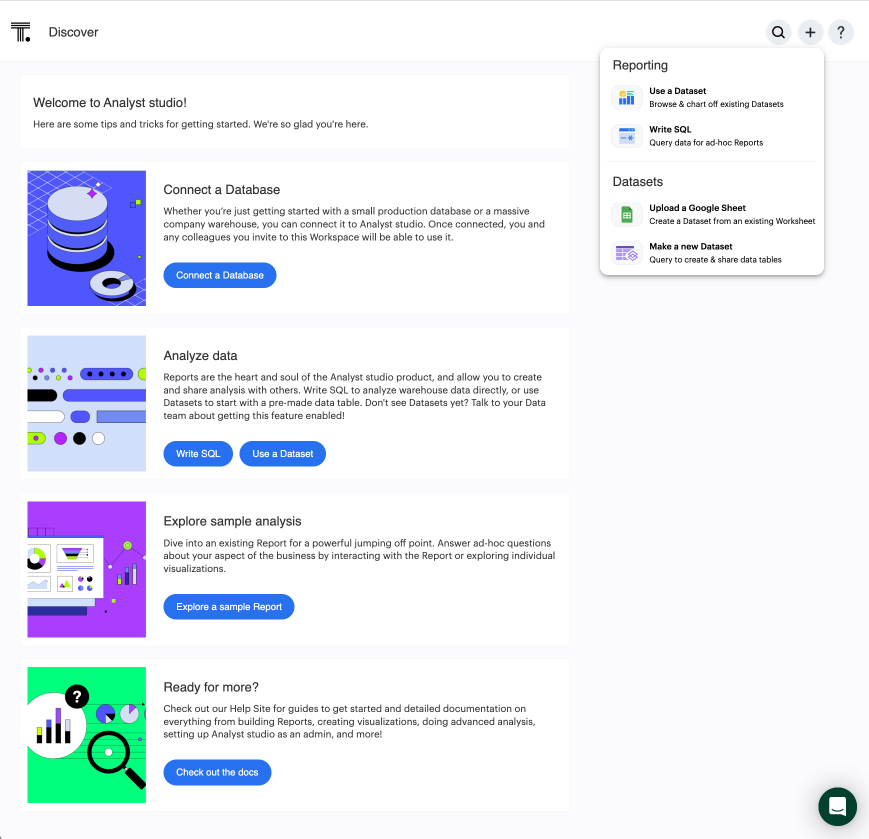
Analyst Studio Beta
ThoughtSpot introduces Analyst Studio, where you can write SQL queries to create reusable Datasets. You can set schedules to refresh Datasets, or publish them to the Data Workspace, where you can join multiple Datasets to query as a whole. ThoughtSpot’s enhanced identity and access management (IAMv2) allows users with the Can manage/access analyst studio privilege to navigate to Analyst Studio seamlessly from the Analyst Studio tab or app switcher.
For more information, see Analyst Studio and Understand RBAC and privileges.
Liveboard schedule available to all users Early Access
ThoughtSpot introduces access to Liveboard schedules on the home page. Users can now see all Liveboard schedules that they are subscribed to in a new section on the home page. From this page, you can edit Liveboard schedules that you created. Administrators can edit the Liveboard schedule for all schedules from this page.
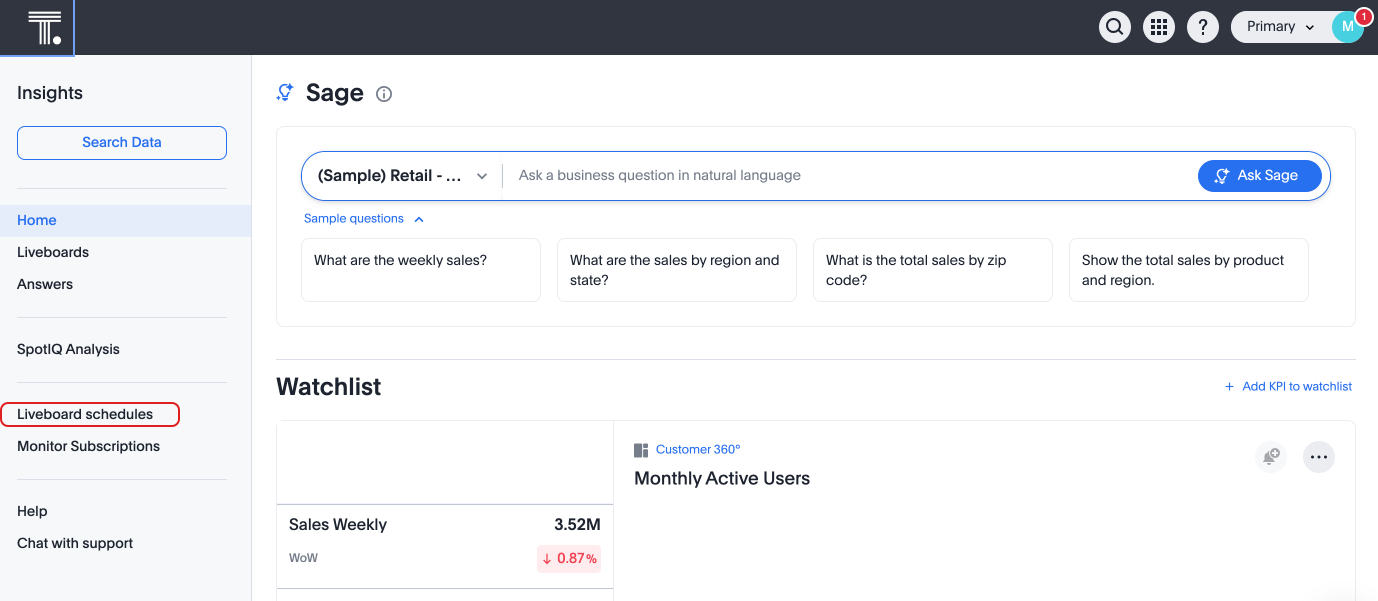
For more information, see New home page and persona-based navigation.
Other features and enhancements
Monitor the application of row-level security
You can now track whether or not row-level security is applied to queries. Risk and compliance analysts can track the volume of queries with row-level security applied versus those without. A row-level security tag is included in the sql query. This provides the ability to determine the number of queries that have included row-level security via the underlying database.
Each query log contains a comment as follows:
isRLSApplied: true/false.
Allow only ThoughtSpot users and groups to be added to schedules
ThoughtSpot schedules can be configured to prevent new and existing schedules from being sent to external emails. To enable this feature, contact ThoughtSpot support.
For more information, see Schedule a Liveboard job.
Categorization for Connections Early Access
You can now choose to sort Connections by type rather than order added to ThoughtSpot. To enable this feature, contact your administrator. For more information, see Categorizing Connections.
Org-specific URLs Early Access
ThoughtSpot introduces Org-specific URLs. URLs in emails now include Org context so that users are taken directly to the correct Liveboard in the correct Org even if they belong to multiple Orgs. You can also move between different browser tabs that point to different Orgs.
Local authentication support with IAMv2 Early Access
ThoughtSpot allows customers to enable or disable local authentication at the Org and cluster levels. To enable local authentication at the cluster level, administrators require the Can manage authentication privilege. To enable local authentication at the Org level, contact ThoughtSpot support.
| Org level settings override cluster level settings. |
For more information, see Managing local authentication.
Option to set new navigation and homepage experience as default Early Access
Administrators now have the ability to set the new navigation and homepage experience as the default UI for all users of the cluster, if it is enabled for the cluster. This feature is available in the Admin > Early access features page. For more information, see Enable Early Access features.
For the Developer
For new features and enhancements introduced in this release of ThoughtSpot Embedded, see ThoughtSpot Developer Documentation.
10.1.0.cl
August 2024 10.1.0.cl
| Features marked as Beta are off by default. To enable them, contact ThoughtSpot support. |
Anomaly-based alerts Early Access
You can now receive alerts when data of KPIs you are subscribed to fall outside the predicted value range.
When creating an alert, you can specify the time and frequency at which ThoughtSpot checks the KPI’s data against the values predicted by ML models trained on the data. For example, you can create an alert for a sales weekly KPI, and specify that ThoughtSpot compare the values every Monday at 5 PM. You may also add individual subscribers to the alert. If the KPI’s data falls outside the predicted range, ThoughtSpot sends an alert to your email and, if applicable, your subscribers' emails.
For more information, see Create an anomaly alert.
Keywords "of" and "percentage of"
The "of" and "percentage of" keywords are now on by default and available to all users. You can use the "of" and "percentage of" keywords to answer questions related to mix, contribution, share of, percentage, and total ratios. These keywords help answer questions such as, "What is the share of a certain store’s sales as a percentage of the regional whole?" To try out this feature, enter a search phrase in the search bar containing the keyword, such as sales percentage of store region, and press Go.
For more information, see Keywords: Of and Percentage of.
Sort and filter fragment and query feedback
You can now sort and filter columns in the Sage Coach fragment and query feedback pages.
You can also search for specific values for worksheet, feedback provider, and edited by to further narrow your selection.
Semi-additive measures with first and last values
Semi-additive measures with first and last values are now available to all users and on by default. A semi-additive measure, also known as snapshot data, is a measure that is usually aggregated for all attributes except for date and time. For certain measures, like inventory, you want to know what the value was at the beginning or end of a period. In that case, you can use the last_value function to find the inventory at the end of a month, rather than aggregating all values over the month. Similarly, you can use the first_value function to find out your stock at the beginning of a month.
For more information, see
Semi-additive measures with first_value and last_value functions.
Import and export sets using TML Beta
You can now use TML to import and export column sets and query sets in ThoughtSpot.
For more information, see TML for Sets.
Other features and enhancements
OAuth for Starburst using Proof Key for Code Exchange (PKCE)
We now support OAuth with PKCE for Starburst.
Bridge connectivity for Cloud Data Warehouses (CDWs) and Databases
Bridge provides options to securely connect your data source with the ThoughtSpot Cloud, as an alternative to PrivateLink, VPC Peering or VPN tunnels. We support Bridge for the following Connectors:
-
Amazon Athena
-
Amazon Redshift
-
Databricks
-
Google BigQuery
-
PostgreSQL
-
Snowflake
-
Starburst
-
Trino
For more information, see Bridge connector for Cloud Data Warehouses.
Local authentication support with IAMv2 Early Access
ThoughtSpot allows customers to enable or disable local authentication at the Org and cluster levels. To enable local authentication at the cluster level, administrators require the Can manage authentication privilege. To enable local authentication at the Org level, contact ThoughtSpot support.
| Org level settings override cluster level settings. |
For more information, see Managing local authentication.
Org-specific URLs Beta
ThoughtSpot introduces Org-specific URLs. URLs in emails now include Org context so that users are taken directly to the correct Liveboard in the correct Org even if they belong to multiple Orgs. You can also move between different browser tabs that point to different Orgs.
For more information, see Multi-tenancy with Orgs.
For the Developer
For new features and enhancements introduced in this release of ThoughtSpot Embedded, see ThoughtSpot Developer Documentation.
10.0.0.cl
July 2024 10.0.0.cl
| Features marked as Beta are off by default. To enable them, contact ThoughtSpot support. |
Advanced conditional formatting Early Access
In addition to using conditional formatting to visually highlight a threshold in a measure (for example, sales > 10000), you can now use conditional formatting to compare a column’s measures to another column.
For example, if you search for sales this year compared to sales last year, you can highlight where sales this year were less than last year. You can set multiple conditional formatting rules to a single table. To enable this feature, contact your administrator.
For more information, see Advanced conditional formatting.
Grouping measures in pivot tables Beta
ThoughtSpot now supports grouping measure in pivot tables. You can now move measures, and position them where you want in rows and columns. For more information, see Pivot tables.
Other features and enhancements
IAM v2 migration
ThoughtSpot is upgrading our Identity and Access Management (IAM) capabilities to provide a more secure login and authentication experience. This experience has been improved to ensure that you can upgrade to IAM v2 easily and with minimal downtime. For more information, see Identity and Access Management V2.
Org deletion
You can now delete an Org without first manually deleting the data objects, connections, groups, and users within the Org. For more information, see Create.
Version control for Liveboards and Answers
Version control for Liveboards and Answers is now available to all users. Now teams of analysts can more easily collaborate on content development of Liveboards and Answers. You can enable version control on specific Liveboards and Answers. With version control enabled, every time you save the Liveboard or Answer, a new version is created and stored. You can browse the version history in ThoughtSpot and restore any saved versions whenever you need to. To enable this feature, contact your administrator.
For more information, see Version control for Liveboards and Answers.
For the Developer
For new features and enhancements introduced in this release of ThoughtSpot Embedded, see ThoughtSpot Developer Documentation.
9.12.5.cl
June 2024 9.12.5.cl
| Features marked as Beta are off by default. To enable them, contact ThoughtSpot support. |
Redesigned home page Early Access
In this release, you can try our redesigned and customizable home page, where you can ask natural-language questions with Sage, view your watchlist, favorites, library of Answers and Liveboards, and more. With the new left-hand navigation, you can go directly to your Liveboards, Answers, SpotIQ Analysis, and Monitor Subscriptions.
This new home page experience is disabled by default. Contact your ThoughtSpot administrator to enable this feature for your cluster. After that, open your user profile, and in the Experience section, set the Navigation and Homepage to New experience. Note that this setting also enables persona-based navigation.
New persona-based navigation Early Access
In this release, you can try our completely redesigned navigation experience organized by persona. The new app switcher allows business users, analysts, data engineers, administrators, and developers to work in separate contextual sections designed specifically for their needs. In addition, each app has left-hand navigation to create better consistency and ease of use for users switching between the different apps.
This new navigation experience is disabled by default. Contact your ThoughtSpot administrator to enable this feature for your cluster. After that, open your user profile, and in the Experience section, set the Navigation and Homepage to New experience. Note that this setting also enables the redesigned home page.
Drill down in change analysis
Drill down in change analysis is now on by default and available to all users. You can now drill down on specific columns in change analysis, in order to identify change drivers within your data. For example, if you run an analysis on sales monthly and find out that the 'jacket' item type changed the most, you can easily drill down on jacket sales and identify which region contributed the most to the change in sales.
Forecasting Early Access
You can now use SpotIQ analysis to forecast future trends for your KPIs. ThoughtSpot uses machine learning models that learn from past trends, growth, and seasonality to project how the target metric will trend in the future. To enable this feature, contact your administrator.
Note tile enhancements
ThoughtSpot introduces the ability to customize note tiles. You can now customize the appearance of note tiles. You can also edit hyperlinks and iFrames that previously had to be deleted and replaced to make changes. Images within note tiles are now responsive to screen size.
Query sets Early Access
You can create query sets, which can be used to classify values in a list that you can then reuse across multiple analyses. A query set is a custom group of values from a collection of objects in your database. Query sets are community objects which remain when you navigate away from the Search Data page and can be used by any user with view access to the underlying Worksheet. To enable this feature, contact ThoughtSpot support.
Custom charts Beta
You can now use custom charts created outside of ThoughtSpot, including third-party chart libraries. To enable this feature, contact ThoughtSpot support. For more information, see Custom charts.
Alation authentication
You can now connect to Alation using token-based authentication as well as service account authentication. For more information, see Alation catalog integration.
Sage Coach enhancements
We made the following changes to Sage Coach:
-
Only users with Worksheet editing rights can promote feedback to the global access level so that it applies user queries on the Worksheet.
-
Once feedback is promoted to global access level, users without worksheet editing access cannot take any actions on it. For more information on the changes in the permission model, refer to Sage Coach permissions.
-
When a Worksheet column is modified, such as a column name change, the changes are reflected in Sage Coach feedback. When a column is deleted, any feedback using that column is also removed. While saving a changed Worksheet, you have the option to review the impacted feedback, ensuring accurate updates upon confirmation.
-
You can now edit query fragment text before submitting feedback. Additionally, you can edit the natural language query terms along with the Answer tokens through the Sage Coach flow.
Save table layouts in the schema viewer
ThoughtSpot introduces the ability to save table layouts in the schema viewer. Table location and size are now maintained and saved in the schema viewer.
Language updates
ThoughtSpot now supports Korean and we’ve also added synonyms for date and time based keywords in German and French for a more accurate experience.
Other features and enhancements
Rules to sort TML
ThoughtSpot introduces a consistent sort order when exporting the TML of an object (table, SQL view, Liveboard, etc.). This ensures that unnecessary differences don’t show up between TML files when the objects haven’t really changed, and makes it easier to compare TML files.
Role-based access control Early Access
Role-based access control (RBAC) is now available to all users. RBAC allows for more granular access privileges. Use RBAC to apply privileges customized for your organizational needs.
To enable RBAC, contact ThoughtSpot support.
| Once you enable RBAC it cannot be disabled. |
For the Developer
For new features and enhancements introduced in this release of ThoughtSpot Embedded, see ThoughtSpot Developer Documentation.
9.12.0.cl
April 2024 9.12.0.cl
| Features marked as Beta are off by default. To enable them, contact ThoughtSpot support. |
Ask Sage Beta
You can now conversationally search ThoughtSpot using natural language on a Liveboard visualization, asking follow-up questions for further clarification or to take your analysis in a new direction. This conversational approach allows you to begin with a simple question, and ask successive questions to refine the answer you receive. ThoughtSpot translates each natural language question into a query, and answers in chart format. To enable this feature, contact ThoughtSpot support.
For more information, see Ask Sage.
Forecasting Beta
You can now use SpotIQ analysis to forecast future trends for your KPIs. ThoughtSpot uses machine learning models that learn from past trends, growth, and seasonality to project how the target metric will trend in the future. To enable this feature, contact ThoughtSpot support.
For more information, see Forecasting.
Sage Coach
We made the following enhancements to Sage Coach:
-
Sage Coach shows the feedback from the selected Org-ID only.
-
Renamed the labels for Sage Coach under the Data tab as Sage Feedback - Queries and Sage Feedback - Fragments.
-
Added an Edited by column to indicate the last person to edit specific feedback in both Fragments and Queries pages.
-
Added a Rating column to the Fragments page to record whether the original Answer was rated accurate or inaccurate.
-
Added a Chart preference column to the Queries page.
-
Added an Access column to the Sage Feedback - Fragments page to record whether the access level is user-level or global to make it consistent with Sage Feedback - Queries page.
Collibra integration
Collibra integration is now available to all users and on by default. You can now see verification status and descriptions on tables and columns imported from Collibra. This information appears when you click on the corresponding table or column in Search data. Once connected, this information is visible to all users. For more information, see Collibra catalog integration.
Show underlying data sources
ThoughtSpot now shows you which data sources are used in a Liveboard. A Liveboard may contain visualizations from many data sources. Authors may choose to use this feature to provide other Liveboard editors with access to the underlying data sources.
The data sources appear in the Show Liveboard details modal under Data source.
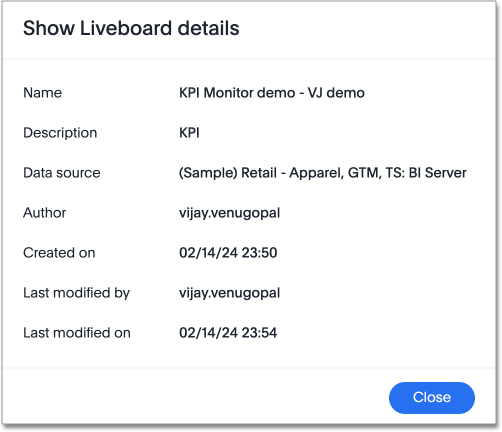
| If a data source is unavailable due to permissions, a message appears to indicate that in place of the data source name. |
For more information, see Details about a Liveboard.
Support for Excel (XLSX) attachments in Scheduled Liveboards
ThoughtSpot introduces support for scheduling Liveboards with Excel (XLSX) attachments, in addition to the existing PDF and CSV options. This allows users to explore tabular data from these reports by using the XLSX data files. For more information, see Schedule a Liveboard job.
Filters are now available for Liveboards with hidden columns included in a visualization
You can now change the filter values on Liveboards that have visualizations that include hidden columns, or a formula created from a hidden column.
Liveboard filters are now accessible to all users who have view or edit permissions to the underlying data source.
| Previously, users who did not have edit access to the underlying worksheet of a Liveboard with filters, could not update the Liveboard filters if the Liveboard used a hidden column. This was the case even if the user had view access to the underlying worksheets. |
For more information, see Liveboard filters.
Mobile app updates
-
Ask Sage on mobile
-
You can now use Ask Sage on mobile version 3.0.0. Ask Sage is a conversational experience that allows you to ask simple follow-up questions on visualizations in a Liveboard using natural language. You can effortlessly gain deeper insights on your metrics.
-
Remember personalized columns in change analysis
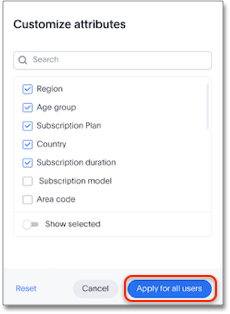
Personalized columns are now available to all users and on by default. Users with edit permissions on a Liveboard can set their preferred attribute columns through the change analysis window and select Apply to all users to keep those selections for any subsequent change analysis calculations on that Liveboard. Individual users can still override these preferences for their own calculations.
For more information, see Remember personalized columns.
Drill down in change analysis Early Access
You can now drill down on specific columns in change analysis, in order to identify change drivers within your data. For example, if you run an analysis on sales monthly and find out that the 'jacket' item type changed the most, you can easily drill down on jacket sales and identify which region contributed the most to the change in sales. To enable this feature, contact your administrator.
For more information, see Iterative change analysis.
Semi-additive measures with first and last values Early Access
A semi-additive measure, also known as snapshot data, is a measure that is usually aggregated for all attributes except for date and time. For certain measures, like inventory, you want to know what the value was at the beginning or end of a period. In that case, you can use the last_value function to find the inventory at the end of a month, rather than aggregating all values over the month. Similarly, you can use the first_value function to find out your stock at the beginning of a month. To enable this feature, contact your administrator.
For more information, see
Semi-additive measures with first_value and last_value functions.
Version control for Liveboards and Answers Early Access
Now teams of analysts can more easily collaborate on content development of Liveboards and Answers. You can enable version control on specific Liveboards and Answers. With version control enabled, every time you save the Liveboard or Answer, a new version is created and stored. You can browse the version history in ThoughtSpot and restore any saved versions whenever you need to. To enable this feature, contact your administrator. For more information, see Liveboards and Answers.
ThoughtSpot Sync
We made the following enhancements to ThoughtSpot Sync:
-
Using ThoughtSpot Sync, you can now sync data directly from an Answer or a custom SQL view, to Excel.
-
You can now click the preview link when you create a Sync from the Data workspace to see a preview of the resulting Answer, Liveboard, or Custom SQL view. Answer, Liveboard, and Custom SQL view previews appear in a new tab.
-
When running a Sync, you can see the following information depending on the destination:
-
Slack: channel name
-
Microsoft Teams: team and channel
-
Sheets: file name and spreadsheet name
-
All others: object name and operation name
-
Other features and enhancements
Collibra catalog integration
Collibra catalog integration is now available to all users and on by default. You can now import metadata information related to your tables and columns from Collibra into ThoughtSpot. From the Data tab, you can set up a connection to Collibra to import column descriptions, column verification status, table descriptions, and table verification status.
For more information, see Collibra catalog integration.
Redshift AWS IDC OAuth
We now support Redshift connections using AWS IDC OAuth. For more information, see Configure AWS IDC OAuth for a Redshift connection.
Snowflake secondary role configuration for External OAuth
ThoughtSpot now supports secondary role configuration when you create a Snowflake connection using External OAuth. When you set secondary roles to ALL, you can access all tables that any single role has access to and combine them in a single SQL query without having to switch roles.
For more information on primary and secondary roles, see Enforcement model with primary role and secondary roles and Add a Snowflake connection.
Multiple configurations for Snowflake connections Early Access
You can now create multiple configurations for each Snowflake connection. This allows you to allocate a separate Snowflake warehouse for different ThoughtSpot users or groups, eliminating the need to duplicate Liveboards and configure multiple Snowflake connections and helping you with cost tracking and chargeback. You can also use this for your search indexing so that you can control and balance the computing load. In addition, this allows you to easily test a set of Liveboards against different environments (dev, qa, prod), and configure different databases for multi-tenancy / multi-org deployments. For more information, see Creating additional configurations for your Snowflake connection.
Manage onboarding configuration at the Org level
You can now manage onboarding configuration at the Org level. Now an Org administrator can update their onboarding configuration in the Admin panel without the need to contact the tenant administrator. This feature helps to reduce possible service interruptions by allowing you to make configuration changes per Org instead of taking the whole cluster down.
Enabling GIT integration for version control of Liveboards and Answers Early Access
Administrators can now enable version control of Liveboards and Answers. You enable version control for your ThoughtSpot Org by connecting it to a Github repository. Once enabled for the Org, version control can be enabled individually for any Liveboard or Answer. Each time a user saves changes, a new version of the Liveboard or Answer is created and stored in your Github repository. Users can easily browse and restore an older version from the Liveboard or Answer itself. For more information, see Version control for Liveboards and Answers.
User Adoption Liveboard
You can now use the User Adoption Liveboard to understand how ThoughtSpot is saving you time with ad-hoc insights, and how many users are accessing ThoughtSpot and creating new insights every month. For more information, see User Adoption Liveboard and User Productivity.
Connection TML
You can now use the table TML file to make changes to connection details like remapping columns and changing data type, rather than using the connection.yaml file. This allows you to make small changes to a Connection without the need to resolve all possible errors first. You can also edit or export the Connection TML file from the Data workspace. For more information, see TML for connections.
Demo data publishing on Enterprise Orgs
ThoughtSpot now supports demo data access at the Org level. Customers can leverage this functionality to allow users to try building Answers and Liveboards. This is available to all users in the Org, and users are added to Demo Data Retail group by default. Org administrators can remove users from this group to remove their access to Demo Data.
For the Developer
For new features and enhancements introduced in this release of ThoughtSpot Embedded, see ThoughtSpot Developer Documentation.
9.10.5.cl
April 2024 9.10.5.cl
| Features marked as Beta are off by default. To enable them, contact ThoughtSpot support. |
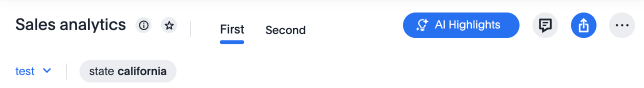
AI Highlights Early Access
With AI Highlights, you get quick insights on how top metrics have changed in your Liveboard, dramatically reducing the time to derive insights from your KPIs. To enable this feature, contact your administrator. For more information, see AI Highlights.
Mode connector Early Access
ThoughtSpot now supports connections to Mode. Import reusable Datasets created in Mode as table extracts to leverage the full ThoughtSpot product, from Worksheet/Model creation to Search, Answer creation, and KPI monitoring. For more information, see Connect to Mode.
Answer data panel enhancements
Now in the new Answer data panel, you can filter as you hover on a column, By category grouping by default, and display the information panel when you click a column.
Mobile app updates
-
Note tiles on mobile
-
You can now view note tiles for Liveboards in the mobile app. This feature is available in version 2.9.0 of the ThoughtSpot mobile app.
-
Collibra integration Beta
You can now see verification status and descriptions on tables and columns imported from Collibra. This information appears when you click on the corresponding table or column in Search data. Once connected, this information is visible to all users. To enable this feature, contact ThoughtSpot support.
For more information, see Collibra integration.
Custom charts Beta
You can now use custom charts created outside of ThoughtSpot, including third-party chart libraries. To enable this feature, contact ThoughtSpot support. For more information, see Custom charts.
Custom sets Early Access
You can create custom sets, which can be used to classify values in a list that you can then reuse across multiple analyses. ThoughtSpot introduces custom column sets in this release. A column set is a custom group of values from a single column. For example, you can use custom sets to define regions with specific countries included or excluded. Custom sets are community objects which remain when you navigate away from the Search Data page and can be used by any user with view access to the underlying Worksheet. To enable this feature, contact ThoughtSpot support.
For more information, see Custom sets.
ThoughtSpot Sync for Google BigQuery
ThoughtSpot Sync for Google BigQuery is now on by default and available to all users. Using ThoughtSpot Sync, you can now sync data directly from an Answer or a custom SQL view, to your Google BigQuery cloud data warehouse. For more information, see Sync data from ThoughtSpot to Google BigQuery.
Remove additional information when exporting a Liveboard as a CSV
ThoughtSpot allows users to export a Liveboard as a CSV. By default, the exported CSV has some additional information, such as filters applied, and user information. ThoughtSpot introduces the ability to remove this additional information when exporting a Liveboard as a CSV. By default, this feature is turned off. To enable this feature, contact ThoughtSpot support.
Other features and enhancements
Collibra catalog integration Beta
You can now import metadata information related to your tables and columns from Collibra into ThoughtSpot. From the Data tab, you can set up a connection to Collibra to import column descriptions, column verification status, table descriptions, and table verification status. To enable this feature, contact ThoughtSpot support.
For more information, see Collibra integration.
Click and drag to create joins with Models Early Access
You can now create joins in your Model by clicking and dragging from one table to another.
Granular privileges for can-manage-data Beta
ThoughtSpot Role-Based Access Control (RBAC) enhances the granularity of permissions with the addition of new data management privileges. The following data control privileges have been added:
-
Can create/edit Connections
-
Can manage data models
-
Can manage custom calendars
-
Can upload user data
RBAC is disabled by default. To enable this feature, contact ThoughtSpot support.
Feedback review
We made the following changes to ThoughtSpot feedback review for AI Answers:
-
Feedback for AI Answers is now Org-aware.
-
When you make a change to a Worksheet, ThoughtSpot now alerts you if this will affect any related query feedback. If you accept this and make the change, the feedback depending on that Worksheet is deleted.
Sharing dbt connections
You can now select a dbt connection and click Share to share the connection with other users or groups. By default, the underlying Cloud data warehouse connection is shared. Note that you need Can manage data privileges to access and share dbt connections. For more information, see Share a dbt connection.
dbt error message handling
ThoughtSpot displays dbt error messages that clearly describe whether the error originated in dbt or in ThoughtSpot, where the error was encountered, and what steps users should take to resolve the issue. For a list of the error messages ThoughtSpot supports, see dbt error messages.
Join enhancement for dbt connections
When creating a Worksheet from a dbt connection, ThoughtSpot joins the tables based on the relationships defined in the underlying .yml schema file. Now, joins between the tables will be created local to the Worksheet instead of creating a global join between the tables.
Ts_Groups system variable
ThoughtSpot now supports the ts_groups system variable in Answer and Worksheet formulas. You can use the ts_groups variable for data masking, or deciding whether to display the value of a column to a user based on their group membership. For more information, see
Data masking with system variables.
OAuth for Snowflake using Proof Key for Code Exchange (PKCE)
ThoughtSpot incorporates PKCE for Snowflake. The addition of PKCE as an extension of the OAuth 2.0 protocol provides an added layer of security.
Dremio on-premises support for OAuth
Dremio now supports use of OAuth with Dremio on-premises. For more information, see Configure OAuth for a Dremio connection.
Enhancements to error messages for Search and Answers
To improve our error messaging when an error prevents data from loading, we introduced a broader classification that allows you to understand issues more clearly. You can click "Copy error details" to download and send a file to your administrators.
Support for custom URLs in scheduled Liveboard emails
ThoughtSpot introduces support for custom URL links in scheduled Liveboard emails. If your organization has set a custom URL for your clusters, the links in scheduled emails now include the custom URL.
Develop custom charts Beta
Developers can now create custom charts for ThoughtSpot using the ThoughtSpot Charts SDK. To enable this feature, contact ThoughtSpot support. For more information, see Custom charts.
For the Developer
For new features and enhancements introduced in this release of ThoughtSpot Embedded, see ThoughtSpot Developer Documentation.
9.10.0.cl
February 2024 9.10.0.cl
| Features marked as Beta are off by default. To enable them, contact ThoughtSpot support. |
AI Highlights Beta
With AI Highlights, you get quick insights on how top metrics have changed in your Liveboard, dramatically reducing the time to derive insights from your KPIs. To enable this feature, contact ThoughtSpot support. For more information, see AI highlights.
Commenting on Liveboards
Commenting on Liveboards is now on by default and available to all users. You can now add or reply to comments, tag other users, or subscribe to comment threads directly on a Liveboard. Users can point out insights or reach out for clarification without leaving ThoughtSpot. To try it out, click the comment icon to the right of the edit icon, and select the data point you would like to comment on. For more information, see Collaborative Liveboards.
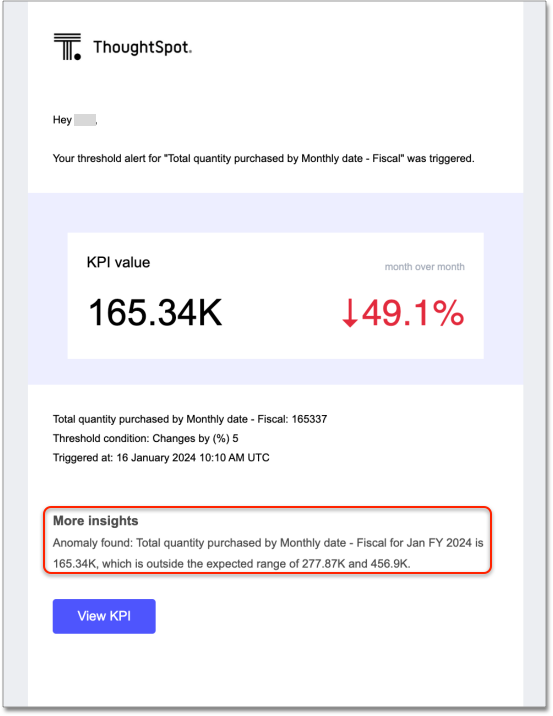
Anomaly insights with Monitor alerts for time-series KPI
When you receive an email about a threshold or scheduled alert, ThoughtSpot now surfaces any anomalies found in your KPI. You can see the expected range of values, and click a link to view your KPI in the original Liveboard. For more information, see Monitor.
Contextual alert creation on KPI charts
ThoughtSpot now preserves the filters you use on a KPI when you create a Monitor alert. Users with view-only access to the underlying Liveboard can now receive alert emails for filtered KPIs without saving the filters on the Liveboard.
Chart customizations Early Access
You can now access advanced chart customization settings for Answers by selecting the Edit chart configuration icon ![]() and selecting Advanced settings. Use these settings to adjust the size and appearance of tooltips, regression lines, gridlines, and chart backgrounds. For more information, see
Advanced chart settings.
and selecting Advanced settings. Use these settings to adjust the size and appearance of tooltips, regression lines, gridlines, and chart backgrounds. For more information, see
Advanced chart settings.

Tooltip customization
Customize tooltips to make charts easier to read and reduce the time to insights for business users. Use customized tooltips to add measures, attributes, and formulas that are not visualized in the chart. You can also customize tooltips to remove certain fields from the tooltips in a complex chart so that you are not overwhelmed with irrelevant information.
Configure the tooltip by selecting the Edit chart configuration icon ![]() and selecting Settings. By default, fields visualized in charts are included in the tooltip. You can remove fields or add fields that are not visualized.
and selecting Settings. By default, fields visualized in charts are included in the tooltip. You can remove fields or add fields that are not visualized.
Null and missing values in charts
You can now choose how null and missing values appear in line, column, and bar charts in ThoughtSpot. Null and missing values appear as bars of 1 pixel width on bar and column charts. You can choose whether to display null date values as zero values, line breaks, or an average of proximate values on a line chart. Rather than showing a sharp decline to zero every time there is null or missing data on your line chart, you can see the missing values represented as line breaks or averages of the closest values instead.
For more information, see Null and missing values in charts.
Iterative change analysis Beta
You can now drill down on specific columns in change analysis, in order to identify change drivers within your data. For example, if you run an analysis on sales monthly and find out that the 'jacket' item type changed the most, you can easily drill down on jacket sales and identify which region contributed the most to the change in sales. For more information, see Iterative change analysis.
Change analysis: remember personalized columns Early Access
Users with edit permissions on a Liveboard can set their preferred attribute columns through the change analysis window and select Apply to all users to keep those selections for any subsequent change analysis calculations on that Liveboard. Individual users can still override these preferences for their own calculations. For more information, see Remember personalized columns.
Natural language search chart type
You can now specify the answering chart type when you use natural language search. For example, search for "show me sales by region as a bar chart", and the results appear in bar chart format. For more information, see Natural language search.
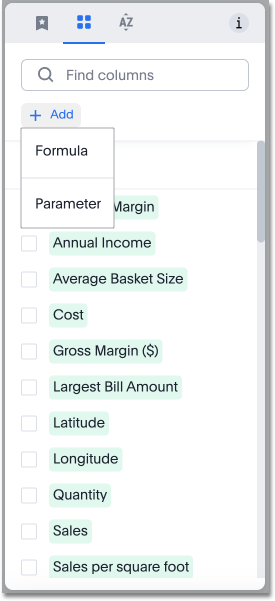
Add formula or parameter to Answer
You can now add a formula or parameter to an Answer by navigating to the Category ![]() or A to Z
or A to Z ![]() view of the Data panel, clicking + Add, and selecting Formula or Parameter.
view of the Data panel, clicking + Add, and selecting Formula or Parameter.
Worksheet summary
With Worksheet summary, when you search using the home page search, you get a natural language description of any Worksheet you select, summarizing the purpose of that Worksheet. You can also see the most popular columns, measures and attributes in the Worksheet, which can help you find the right worksheet.
Functional enhancements for verified Liveboards
You can now easily search for verified Liveboards with trusted content, and filter to view only verified content. Verified Liveboards are identified with a tag visible in all screens. You can also cancel verification requests when needed.
Renaming columns
You can now rename columns in an Answer and see the new name reflected on the table header, tooltips, legend, and chart configuration menu. Changes made to an Answer are not reflected in the underlying Worksheet. For more information, see Rename a table column.
ThoughtSpot Sync for Google BigQuery
Using ThoughtSpot Sync, you can now sync data directly from an Answer or a custom SQL view, to your Google BigQuery cloud data warehouse. For more information, see Sync to Google BigQuery.
Mobile app updates
-
Support OIDC authentication with IAMv2 on mobile
-
If IAMv2 login is enabled on your cluster, you will now be able to log in from your mobile app.
-
-
Internationalization and localization
-
You can now change your ThoughtSpot locale through the Mobile app. When your locale is updated, ThoughtSpot translates labels, date formats and number formats to match the default for your country and language.
-
-
Improve the deep link experience
-
You can share a link to objects in ThoughtSpot using instant messaging or email and the recipient can open the link in the mobile app or the web. If a user has the mobile app, the link will open directly in the mobile app. If they don’t have the mobile app, they are presented with the option to download it or to view it on the web.
-
Other features and enhancements
Custom sorting
Custom sorting is now available to all users and is on by default. ThoughtSpot introduces custom sorting of attributes to sort all chart types in a way that helps users to consume charts more efficiently. You can now sort on any attribute in a chart, using the custom sort column. Enter the attributes in order to set up a custom sort order.
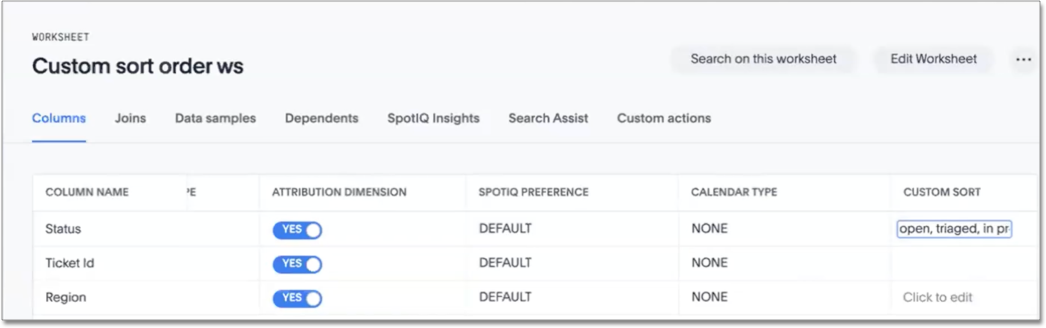
Google Cloud SQL for MySQL connection
You can now create connections from ThoughtSpot to Google Cloud SQL for MySQL.
Validate metadata for connections
You can now validate connections to discover any changes in metadata after the connection was created. When you validate a connection, ThoughtSpot provides a JSON file containing details on the metadata changes. Once alerted to a metadata change, you can use TML to update the connection.
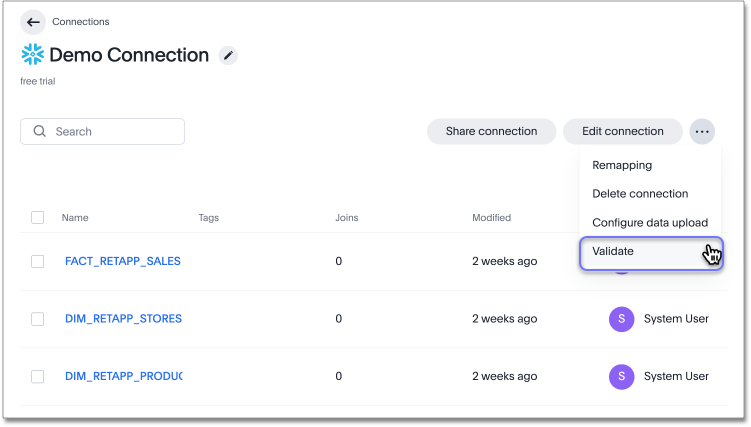
dbt public API
dbt core users can now use the dbt public API to upload dbt project files to ThoughtSpot. Use the dbt sync API to upload your dbt project’s zip files.
dbt version 1.7
ThoughtSpot now supports dbt version 1.7.
SAML group mapping with Orgs
You can now map your SAML groups and Orgs from your IDP to ThoughtSpot. For more information see, SAML group and Org mapping.
OpenID Connect (OIDC) support with IAMv2 Early Access
ThoughtSpot now supports OpenID Connect (OIDC) for SSO with IAMv2. Multiple identity providers with OIDC such as Google , Microsoft, and Amazon are now supported. For more information, see Managing authentication with OIDC using IAMv2.
Bridge connector for Google Big Query
Sometimes connecting ThoughtSpot directly to your Google BigQuery database or changing your VPN/firewall configuration is not possible. For those situations, you can use Bridge to create a connection to your BigQuery database. The Bridge connector is easy to install, configure, and maintain. To enable this feature, contact ThoughtSpot support. For more information, see Add a Google BigQuery connection.
For the Developer
For new features and enhancements introduced in this release of ThoughtSpot Embedded, see ThoughtSpot Developer Documentation.
9.8.0.cl
January 2024 9.8.0.cl
| Features marked as Beta are off by default. To enable them, contact ThoughtSpot support. |
Give feedback to AI-generated Answers
When giving feedback to AI-generated Answers in Sage, you now tell ThoughtSpot what search tokens to use to signify certain key terms. For example, when you search for "best performing products this year", ThoughtSpot responds with the top five products sorted by sum of sales. You can correct top five to top ten by clicking the thumbs-down icon and editing the Answer. ThoughtSpot then stores that feedback, and admin users can decide to apply the feedback globally, so that every time someone searches for "best" products, they receive the top ten results.
Contextual alert creation on KPI charts Early Access
ThoughtSpot now preserves the filters you use on a KPI when you create a Monitor alert. Users with view-only access to the underlying Liveboard can now receive alert emails for filtered KPIs without saving the filters on the Liveboard. To enable this feature, reach out to your administrator.
Change analysis: More insights
Change analysis more insights are now available to all customers and are enabled by default. For example, ThoughtSpot finds values that underwent the highest percentage change between the two data points defined in your analysis, and values whose share of the total changed the most. The insights appear below the main analysis in the change analysis pop-up window. Note that insights do not appear for measures of type unique counts and ratios.
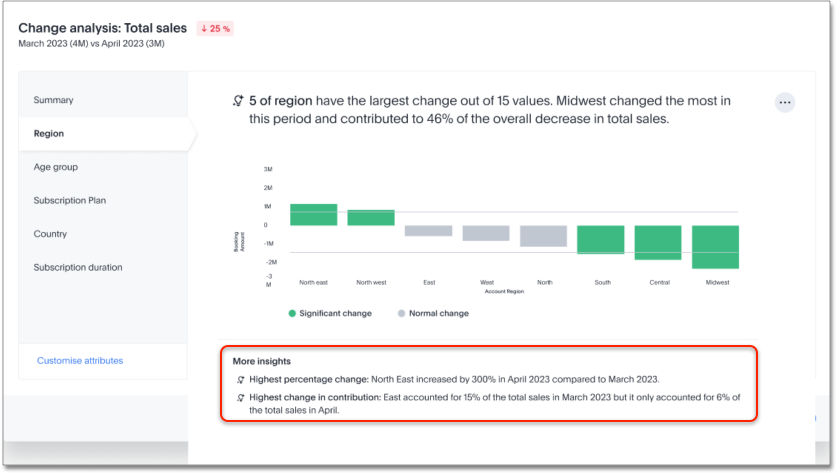
KPI scheduled watchlist alert
When you add a KPI to your home page watchlist, ThoughtSpot automatically creates a scheduled alert. You receive emails with updates to the KPI on a periodic basis. You can edit all scheduled alerts from the Monitor tab. For more information, see Track important KPIs.
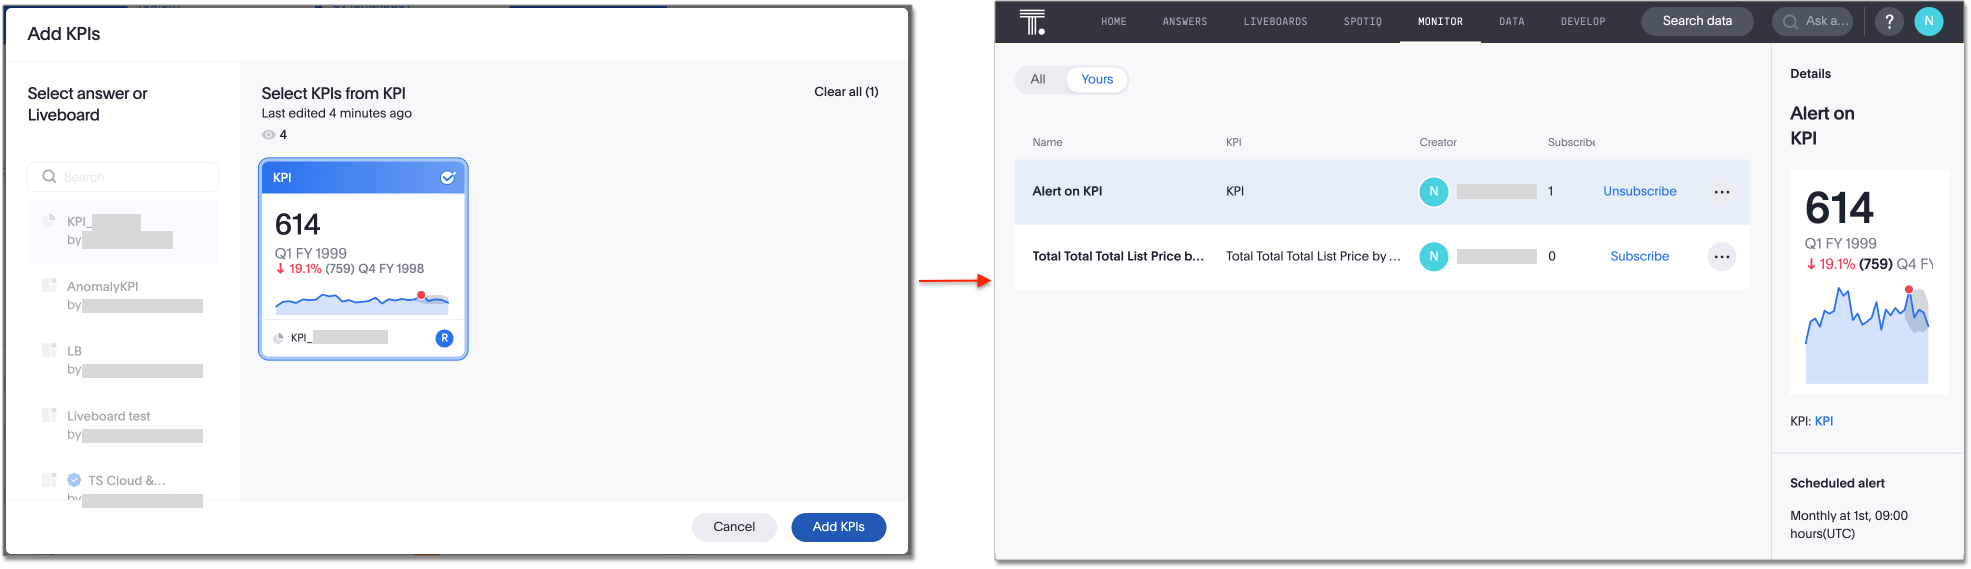
Personalized views
Personalized views are now available to all users and on by default. Personalized views allow you to save your own set of values for filters and parameters in a Liveboard. You can change the values of the already present filters and parameters in a Liveboard and save the view for future use. Any changes made to the master Liveboard are carried over to the view, including changes made to pinned visualizations, tabs, filter chips, and re-ordering. Changes made to the view are not pushed to the master Liveboard. This eliminates the need to make multiple copies of a Liveboard with your preferred filter values, that can fall out of sync with the original.
Atlan
Atlan is now available to all customers and is on by default. You can now see verification status and descriptions on tables and columns imported from Atlan. This information appears when you click on the corresponding table or column in Search data. Once connected, this information is visible to all users.
Sage Coach feedback review
You can now review user feedback from the Data workspace, and determine whether it should apply to only that user’s queries, or to the entire cluster. Use the Query Feedback modal to review feedback given to individual natural language queries, and use the Query Term Feedback modal to review the translation of individual natural language terms to search tokens.
For more information, see Sage Coach.
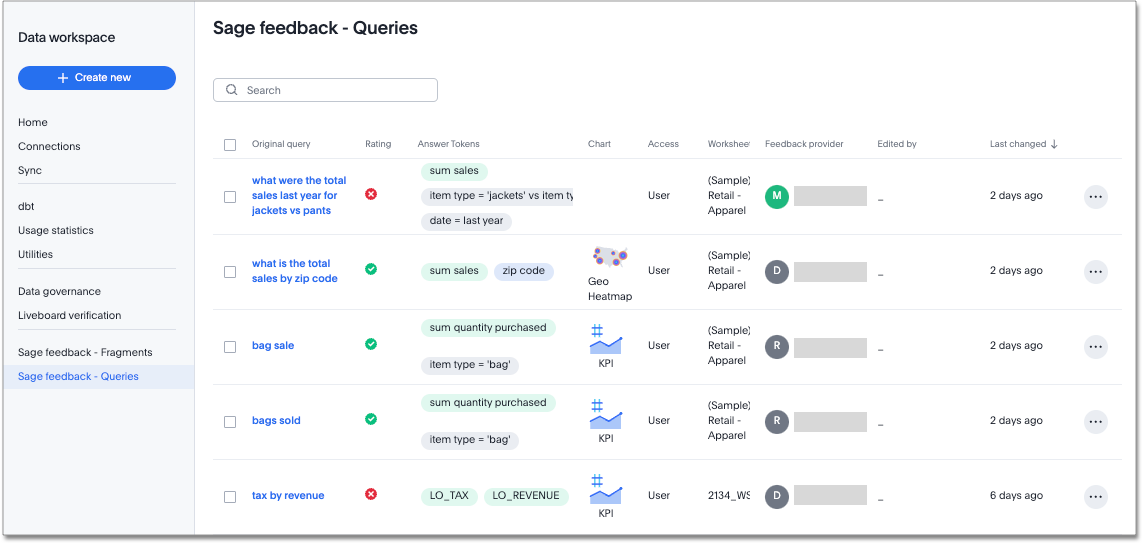
Database as a destination for Answer Sync
Using ThoughtSpot Sync you can now sync data directly from an Answer without having to save the answer first.
Enhancements for TS Sync
ThoughtSpot Sync allows you to connect and share complete Liveboards using Microsoft Teams and Slack. Previously only Answers could be shared.
Custom Sorting Early Access
ThoughtSpot introduces custom sorting of attributes to sort all chart types in a way that helps users to consume charts more efficiently. Previously custom sorting could only be applied to an Answer using custom columns and the search bar, and could not be applied to some chart types. You can now sort on any column in a chart, in ascending or descending order, from the column heading menu. To enable this feature, reach out to your administrator.
Other features and enhancements
Custom calendar enabled by default
In this release, custom calendar is enabled by default for all connections, except for the following which don’t support custom calendar:
-
Dremio
-
Denodo
Connections
The following connections are now available to all customers and are on by default:
-
Google AlloyDB for PostgreSQL
-
Google Cloud SQL for PostgreSQL
-
Google Cloud SQL for SQL Server
-
SingleStore
Atlan catalog integration
You can now import metadata information related to your tables and columns from Atlan into ThoughtSpot. From the Data tab, you can set up a connection to Atlan to import column descriptions, column verification status, table descriptions, and table verification status.
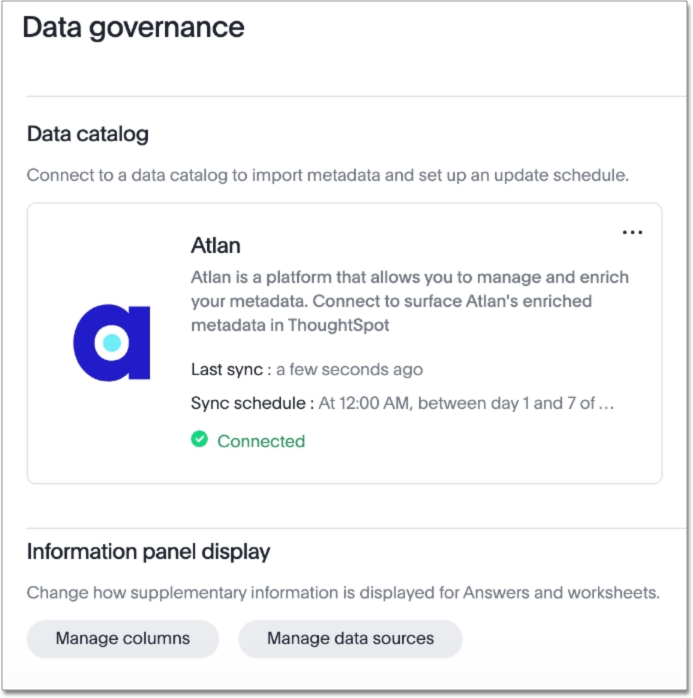
dbt public API
You can now use the dbt public API to perform the following tasks:
-
Create a dbt connection
-
Delete a dbt connection
-
Search a list of dbt connections
-
Update a dbt connection
-
Run dbt Sync
-
Update dbt Sync
OAuth connection improvements
If you do not have a valid OAuth access token, you can now directly navigate to the OAuth authorization screen when performing one of the following actions on a connection shared with you:
-
View sample data
-
Create a custom SQL view
-
Edit the connection
-
Upload a CSV file (Snowflake connections only)
Snowflake account name restrictions
In accordance with Snowflake’s recent JDBC update, ThoughtSpot does not support Snowflake account names that contain underscores for connections that use Private Link. For more information on how to adjust your account name behavior to avoid this restriction, see Snowflake Private Link.
For the Developer
For new features and enhancements introduced in this release, see ThoughtSpot Developer Documentation.
9.7.0.cl
October 2023 9.7.0.cl
| Features marked as Beta are off by default. To enable them, contact ThoughtSpot support. |
Atlan Beta
You can now see verification status and descriptions on tables and columns imported from Atlan. This information appears when you click on the corresponding table or column in Search data. Once connected, this information is visible to all users. To enable the connection to Atlan, contact ThoughtSpot support.
For more information, see Atlan catalog integration.
Mobile enhancements
We made the following improvements to ThoughtSpot mobile:
-
We simplified the sign in process for the ThoughtSpot mobile app. You can now enter your company email to receive an email with a magic link login, rather than entering the server URL.
-
You can now change your ThoughtSpot locale through the Mobile app. When your locale is updated, ThoughtSpot translates labels, date formats and number formats to match the default for your country and language.
-
You can now use SpotIQ analysis to directly identify the key drivers for recent change in your KPIs in ThoughtSpot Mobile. KPI change analysis allows you to drill down into the causes of change in your KPIs and customize the insights generated by SpotIQ.
Personalized Liveboard Views Early Access
Personalized views allow you to save your own set of values for filters and parameters in a Liveboard without editing the original Liveboard. You can change the values of the already present filters and parameters in a Liveboard and save it for future use. The new Liveboard is version of the master Liveboard, so any changes made to the master Liveboard are carried over ot the new Liveboard. This includes changes made to pinned visualizations, tabs, filter chips, and re-ordering. Changes made to the new Liveboard are not automatically pushed to the master Liveboard.
Embedding in note tiles
Embedding in note tiles is now available to all users and is on by default. You can now embed interactive content such as videos, pdfs, or Figma files into Liveboards using the note tile format. To try it out, enter a Liveboard, select the edit icon, and select Add note from the top bar. You can then click the embed icon and enter the URL or iFrame code for your content. You can interact with the content embedded in a Liveboard like you would with a website.
For more information, see Embedding content with iFrames.
System Variables in Answer and Worksheet formulas
Previously, ThoughtSpot supported the ts_username variable for use in row-level security formulas alone. Now, users can access the following string variables:
-
ts_orgname -
ts_email_domain
ts_orgname, ts_username, and ts_email_domain variables are available to use in Answer and Worksheet formulas.
Request access to data source from filter
When creating a filter on a Liveboard or Answer, you must have access to the underlying data source. Users can now request access to the underlying Worksheet through the filter modal on a Liveboard or Answer. For more information, see Liveboard filters.
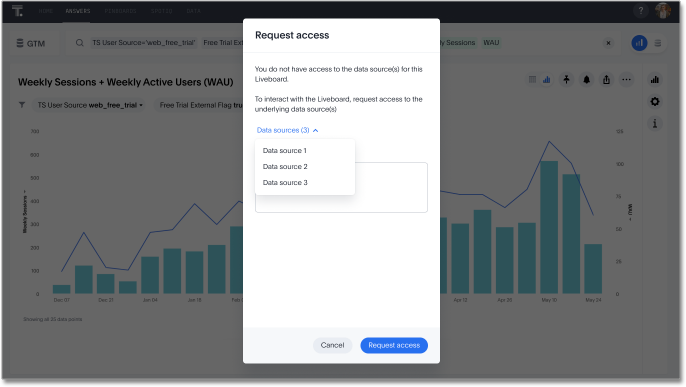
New data panel with tag-based filtering
The new data panel experience is available for all customers in this release, and is enabled by default. In this release, you can now filter data sources by how they are tagged.
For more information, see Start a new search.
Other features and enhancements
Atlan data catalog integration Beta
You can now import metadata information related to your tables and columns from Atlan into ThoughtSpot. From the Data tab, you can set up a connection to Atlan to import column descriptions, column verification status, table descriptions, and table verification status. This information appears when you click on the corresponding table or column in Search data. Once connected, metadata information is visible to all users.
For more information, see Atlan catalog integration.
SAP Hana calculation view input parameters Beta
Now, you can define a parameter to link to the parameter in SAP Hana using TML at the table level, and create a linked_parameter clause to ensure the parameter is displayed in all Answers created from the table. For more information, see TML for tables.
Key Pair authentication for Snowflake
We now support Key Pair authentication for Snowflake.
OAuth for Databricks using Proof Key for Code Exchange (PKCE)
We now support OAuth with PKCE for Databricks.
Roles added to Primary Org Beta
ThoughtSpot introduces role-based access control (RBAC) in Primary Orgs to allow for more granular access privileges. Use roles to apply privileges customized for your organizational needs.
To enable RBAC, contact ThoughtSpot support.
| Once you enable RBAC it cannot be disabled. |
For the Developer
For new features and enhancements introduced in this release, see ThoughtSpot Developer Documentation.
9.6.0.cl
September 2023 9.6.0.cl
| Features marked as Beta are off by default. To enable them, contact ThoughtSpot support. |
Change analysis: More insights Beta
When running change analysis, you can now see additional insights. For example, ThoughtSpot will detect values that underwent the highest percentage change between the two data points defined in your analysis, and values whose share of the total changed the most. The additional insights appear below the main analysis in the change analysis pop-up window.
Embedding in Note tiles Early Access
You can now embed interactive content such as videos, pdfs, or Figma files into Liveboards using the note tile format. To try it out, enter a Liveboard, select the edit icon, and select Add note from the top bar. You can then click the embed icon and enter the URL or iFrame code for your content. You can interact with the content embedded in a Liveboard like you would with a website. To enable this feature, contact ThoughtSpot support.
For more information, see Embedding in note tiles.
Query performance visibility Beta
You can now see the state of query execution for any Liveboard visualization while it loads. If a visualization takes longer than three seconds to load, ThoughtSpot displays the current query execution status (executing query, waiting for connection, or processing query) to help users identify the reason for the delay.
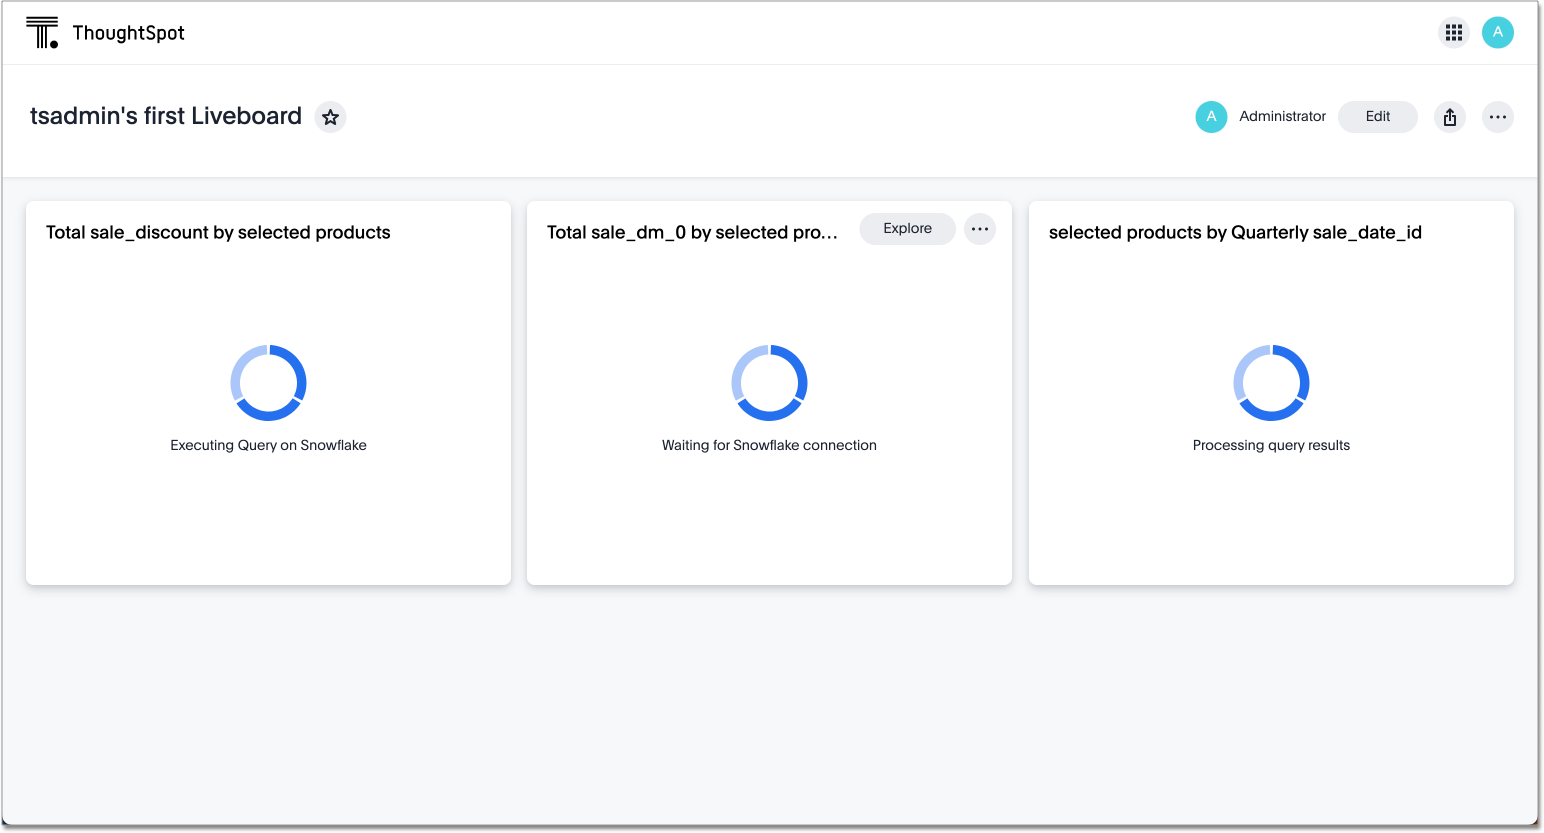
Alation metadata
Alation metadata is now available to all users and on by default. Users can now see metadata information on tables and columns imported from Alation. This information appears when you click on the corresponding table or column in Search data. Once connected, metadata information is visible to all users. For more information, see Catalog integration.
Hidden columns in tables
You can now hide a column from your table without removing it from your current Search. If you hide the column you’re using to sort results, the sorting order is unchanged. To try it out, create an Answer, open the Edit chart configuration menu ![]() , and drag the selected column to Hidden Columns.
, and drag the selected column to Hidden Columns.
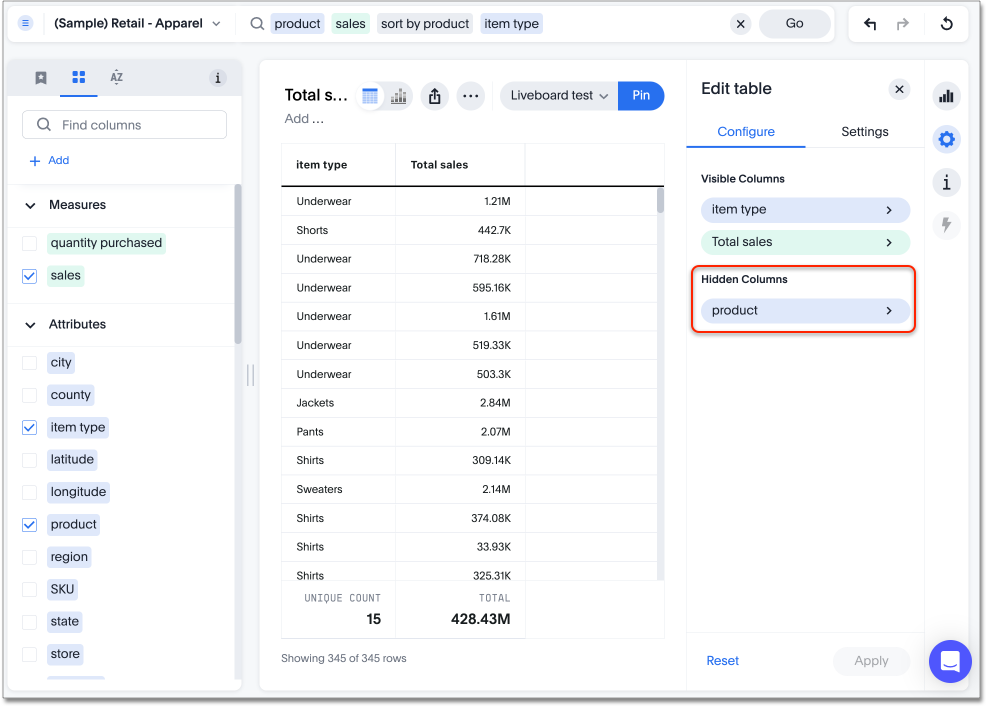
Commenting on Liveboards Early Access
You can now add or reply to comments, tag other users, or subscribe to comment threads directly on a Liveboard. Users can point out insights or reach out for clarification without leaving ThoughtSpot. To try it out, click the comment icon to the right of the edit icon, and select the data point you would like to comment on. To enable this feature, contact your administrator.
For more information, see Comment on a Liveboard.
Natural language narratives Early Access
Beginning in 9.6.0.cl, ThoughtSpot generates insight narratives in natural language to summarize the data analyzed in SpotIQ. The narratives are generated by LLM, and appear above the charts created by SpotIQ. This feature must be enabled by your administrator. For more information, see Natural language narratives.
Verified Liveboards
We made the following enhancements to verified Liveboards:
-
When you request verification, you can now see the underlying data sources that will be shared with the verifier.
-
The name of the Liveboard now appears in verification request emails.
-
When editing an Answer on or pinning an Answer to a verified Liveboard, a warning banner appears indicating it may need to be verified again.
ThoughtSpot Connected Slides
ThoughtSpot Connected Slides is an add-on that allows you to insert charts and live data visualizations right into your Google Slides™ presentation. Just connect to ThoughtSpot, find a chart or visualization, and add it to your slide presentation.
For more information, see ThoughtSpot Connected Slides.
Other features and enhancements
Alation catalog integration
Alation catalog integration is now available to all users and on by default. You can now import metadata information related to your tables and columns from Alation into ThoughtSpot. From the Data governance section of the Data tab, you can set up a connection to Alation to import column descriptions, column verification status, table descriptions, and table verification status.
For more information, see Catalog integration.
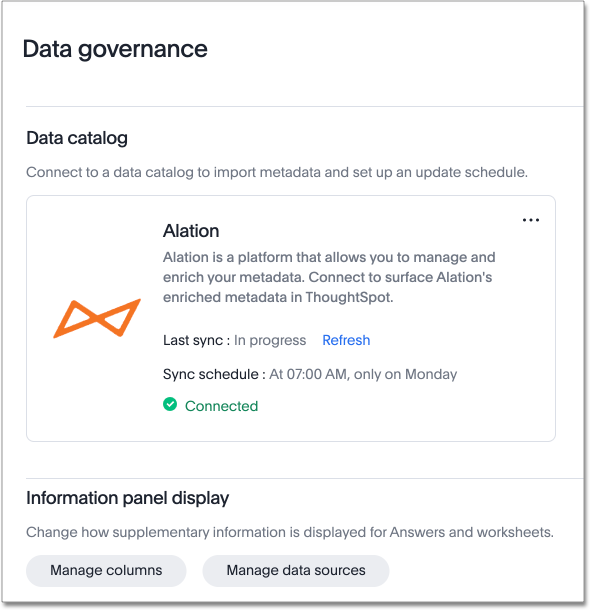
Roles added to Primary Org
ThoughtSpot introduces role-based access control (RBAC) in Primary Orgs to allow for more granular access privileges. Use roles to apply privileges customized for your organizational needs.
To enable RBAC, contact ThoughtSpot support.
| Once you enable RBAC it cannot be disabled. |
Index Statistics Liveboard
Admin users can now see indexing statistics for their cluster using the Index Statistics Liveboard. You can filter the results by connection, table, and column, and see the breakdown of indexed search tokens in the visualizations. This Liveboard helps you see how many search tokens you are using, and can help you diagnose indexing issues and errors. To try it out, go to Liveboards and search for Index statistics.
For more information, see Index Statistics Liveboard.
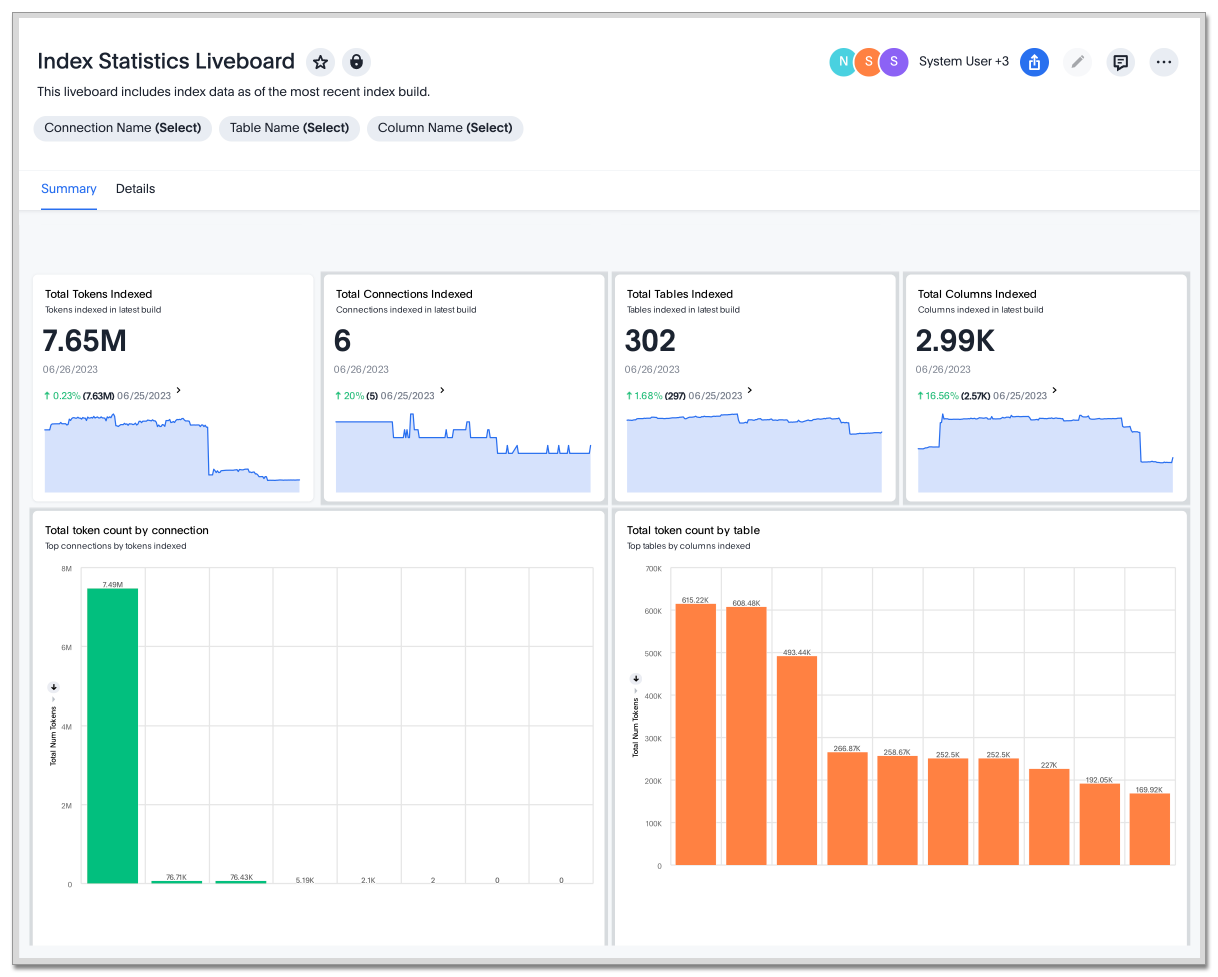
dbt sync
In the past, ThoughtSpot generated a new Worksheet every time a user edited an existing dbt data model. Now, ThoughtSpot maintains a persistent connection with dbt and provides realtime updates. Users can update an object, update an object and create a new object, or simply create a new object.
For more information, see Integrate with dbt.
dbt Worksheet join rule
Previously, when a Worksheet was created from a dbt model, the default worksheet join rule was "apply all joins". Now, "apply joins progressively" is the default. This means that when you search on a Worksheet, joins are applied as each search term is added, rather than applying all joins to every search.
Amazon Athena connection
You can now create connections from ThoughtSpot to Amazon Athena. For more information, see Amazon Athena.
For the Developer
For new features and enhancements introduced in this release, see ThoughtSpot Developer Documentation.
9.5.0.cl
September 2023 9.5.0.cl
| Features marked as Beta are off by default. To enable them, contact ThoughtSpot support. |
ThoughtSpot Sage
Natural language search enhancements
We made the following enhancements to natural language search:
-
The following keywords are now supported in natural language search: "vs", "growth of", and "trend".
-
Title and descriptions are now automatically created when you save an AI Answer.
-
ThoughtSpot now stores feedback in order to correctly answer related questions. For example, if you correct the column used in an Answer about annual recurring revenue for 2023, ThoughtSpot uses the correct column in Answers about annual recurring revenue for 2022 and 2021.
Pivot table enhancements
We made the following enhancements to pivot table charts:
-
When you download an xlsx version of a pivot table, the measure values are displayed as numbers instead of the general format.
-
When you download an xlsx version of a pivot table, row and column labels are shown as separate cells rather than as a column-separated list.
-
You can no longer add conditional formatting to a pivot table in heatmap mode.
-
Naming of subtotals and grand totals are now consistent in the chart and chart configuration dropdown.
-
We now support hyperlinks in pivot tables.
-
You can now choose to show or hide row and column summaries and subtotals, from the chart configuration menu. When summaries and subtotals are enabled, you can choose to display them at the top or bottom of the pivot table.
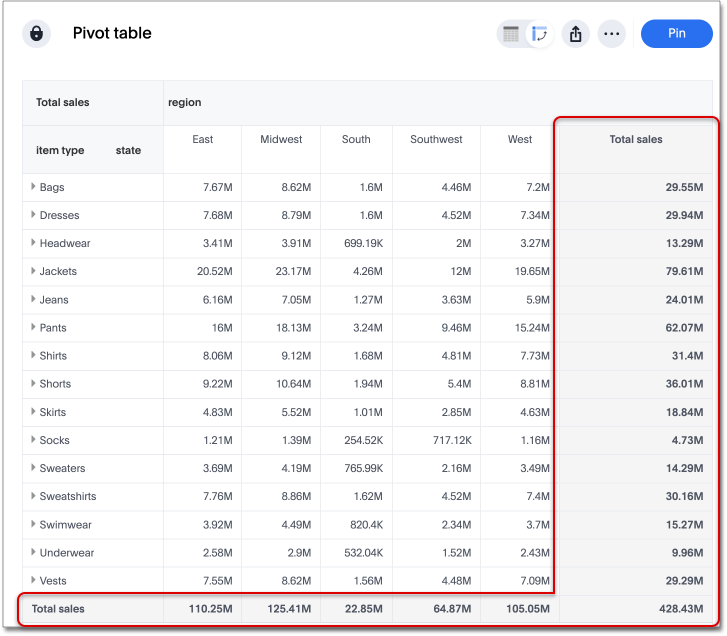
Date picker GA
Date picker is now GA and on by default. We added support for rolling, fixed, and custom date filters when creating an Answer or filtering a Liveboard. Previously, when adding a date filter to a Search, ThoughtSpot supported the conditions ON (=), ON OR AFTER (>=), BEFORE (<), and BETWEEN. Now, you can additionally filter for ON OR BEFORE (<=), NOT BETWEEN, ON LAST, and ON NEXT. To try it out, click the filter icon next to the Date column in the left side menu, or click the date filter below the Answer or Liveboard title.
For more information, see Date filters for Answers and Liveboards.
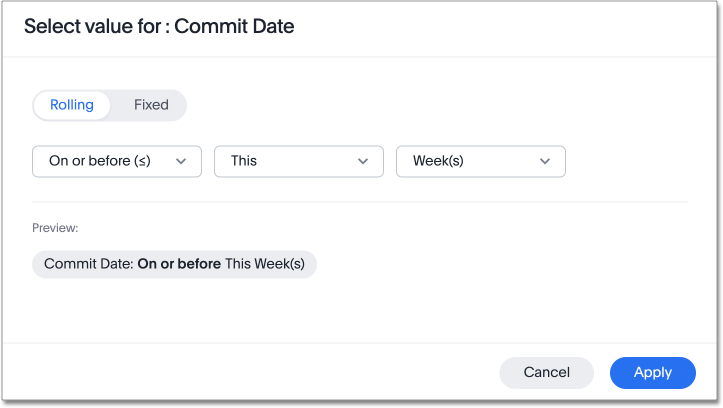
New data panel GA
The new data panel experience is GA in this release. This is part of the Data Fluency feature.
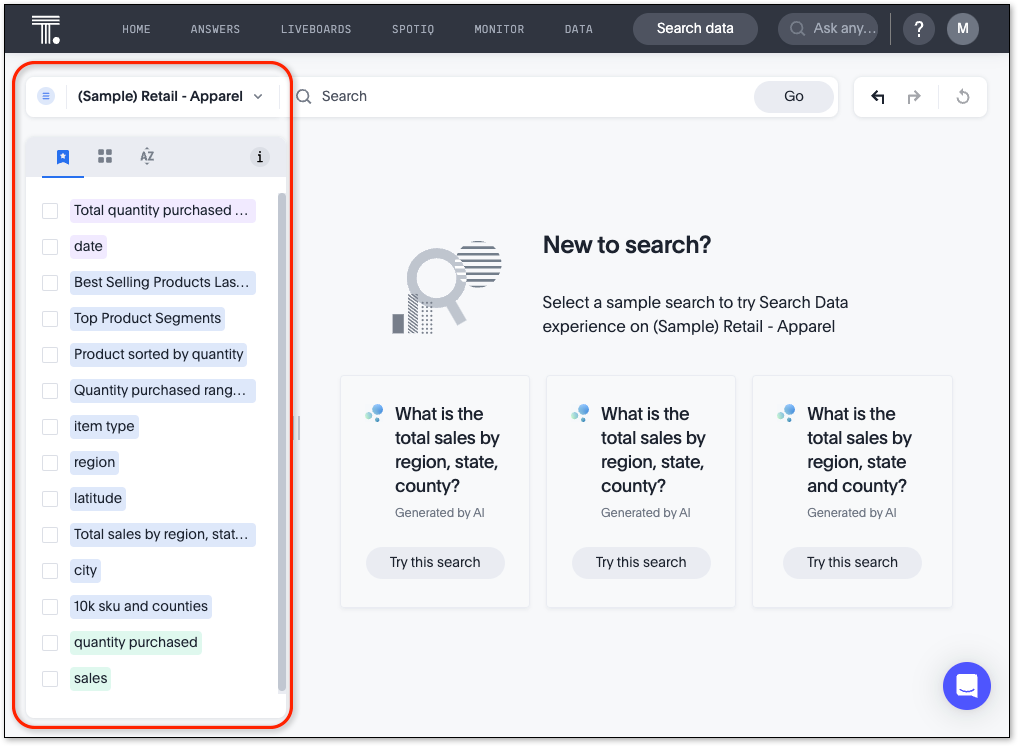
Verified Liveboards
Admin-assigned verifiers can now mark Liveboards as verified. Users can now request these verifiers to review their Liveboards, and verify if the information displayed is trusted content. Verified Liveboards carry a tag that signifies that they have been audited for correctness. For more information, see Verified Liveboards.
Rename filters on a Liveboard
You can now edit the display name of filters on Liveboards to better represent your data. To try it out, click the Edit icon on a Liveboard, click the filter you want to rename, select Filter options.
Chart display enhancements
When you create bar and column charts and slice by color, ThoughtSpot automatically enables gridlines to make the chart easier to read. You can choose to disable gridlines under the chart configuration menu.
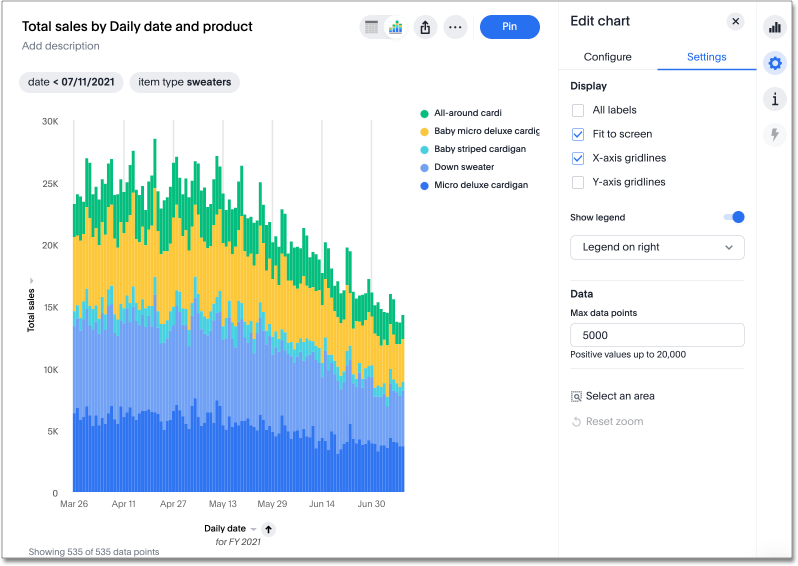
Monitor alerts in ThoughtSpot notifications
You can now see notifications for threshold and anomaly alerts in the ThoughtSpot notification service, rather than receiving emails.
Mobile enhancements
We made the following enhancements to ThoughtSpot Mobile:
-
We extended the length of mobile sessions on ThoughtSpot Cloud. If a user visits the mobile app at least once every two weeks, they will no longer be logged out.
-
We introduced a Watchlist tab on Mobile to make it easier for users to follow important metrics.
-
We simplified the sign in process for the ThoughtSpot mobile app. You can now enter your company email to receive an email with a magic link login, rather than entering the server URL.
Introduction of roles and more granular access privileges
ThoughtSpot introduces role-based access control (RBAC) to allow for more granular access privileges. Use roles to apply privileges customized for your organizational needs.
ThoughtSpot includes some standard roles to help existing customers transition to RBAC. To enable RBAC, contact ThoughtSpot support.
English (Germany) locale
Set your ThoughtSpot locale to English (Germany). ThoughtSpot changes your data format settings, such as currency and number formatting, and translates keywords, ThoughtSpot menu and navigation items, operators, and error messages. To try it out, navigate to your profile, and edit your system language. For more information, see Change language and data format settings.
ThoughtSpot for Connected Sheets add-on
ThoughtSpot Connected Sheets is an add-on for Google Sheets that allows you to connect to a ThoughtSpot instance, pull data directly into a Google Sheet from trusted data sources connected to that instance (like Snowflake, Google BigQuery, DataBricks, and others), and use the tools in Google Sheets for ad-hoc analysis. See ThoughtSpot Connected Sheets.
Other features and enhancements
Org-specific Liveboards for Essentials and Pro edition
In a shared cluster for Essentials and Pro edition, an Org admin can now see the following Org-specific Liveboards:
-
Credit usage
-
Billable query stats
-
User adoption
-
Object usage
-
Performance tracking
-
Usage statistics
Webhooks for KPI monitor alerts Beta
You can create webhooks to initiate workflows in third-party applications based on KPI changes, or send KPI alert notifications to custom channels. For example, if you are monitoring a "current inventory" KPI for an inventory management use case, you can build a workflow to trigger an order placement in a third-party app when your current inventory drops below a particular threshold value. Webhooks for Monitor is in beta and off by default. To enable it, contact ThoughtSpot support. For more information, see Webhooks for Monitor.
Alation data catalog integration Beta
You can now import metadata information related to your tables and columns from Alation into ThoughtSpot. From the Data tab, you can set up a connection to Alation to import column descriptions, column verification status, table descriptions, and table verification status. This information appears when you click on the corresponding table or column in Search data. Once connected, metadata information is visible to all users. For more information, see Catalog integration.
Singlestore connection Early Access
You can now create connections from ThoughtSpot to SingleStore. For more information, see Connect to SingleStore.
Azure AD external OAuth for Redshift
Redshift now supports external OAuth through Microsoft Azure AD. See Configure Azure AD external OAuth for a Redshift connection.
Single value selection for attribute filters
When creating a Liveboard, you can now designate attribute filters as single-select, in addition to multi-select. For example, you could choose to make a Country filter single-select, so users would only see data related to one country at a time.
Fivetran connection to SpotApp
In this release, the Fivetran connection to SpotApp is GA. Fivetran helps you move data from applications like Salesforce, ServiceNow, Jira and others into a cloud data warehouse to make it easier for you to use the SpotApps designed for those applications.
ServiceNow Incident Management (Snowflake Connector for ServiceNow)
In this release, there is a new ServiceNow Incident Management SpotApp which allows you to use your ServiceNow data stored in Snowflake. If you use the ServiceNow Snowflake connector to move your data from ServiceNow to Snowflake, use this SpotApp to track the number of tickets submitted, and understand the efficiency of how those tickets are resolved.
For the Developer
For new features and enhancements introduced in this release, see ThoughtSpot Developer Documentation.
9.4.0.cl
August 2023 9.4.0.cl
| Features marked as Beta are off by default. To enable them, contact ThoughtSpot support. |
ThoughtSpot Sage
Natural language search improvements
We made the following changes to the natural language search feature:
-
Redesigned search results page. Filtering facets are now in the left panel.
-
You can now interact with the Answers created by natural language search, including sorting values and drilling down.
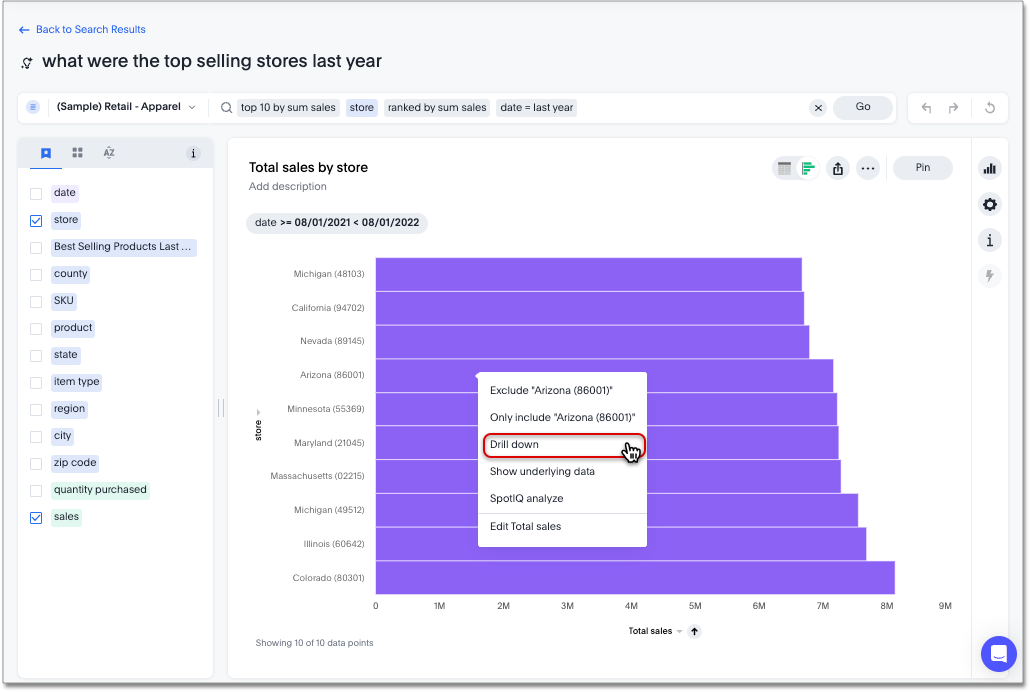
Sage features are disabled by default and available for administrators to enable in the Admin Console.
Once enabled, your ThoughtSpot administrator can grant access to the Natural language search and AI-suggested searches features for users in a group by assigning the Can preview ThoughtSpot Sage user privilege to the group. You do not need this privilege to access AI-generated Worksheet column synonyms.
For more information about ThoughtSpot Sage, see ThoughtSpot Sage.
Contextual change analysis
Contextual change analysis is now GA and on by default. You can now identify the key change drivers for changes in your metrics in a KPI chart. Select the percent change label or select any two data points on the KPI sparkline to view change analysis on your top 5 columns by usage-based ranking (UBR) and identify the reason behind the observed change. You can view the changes in other columns by clicking Customize attributes and selecting the desired column(s).
For more information, see Contextual change analysis.
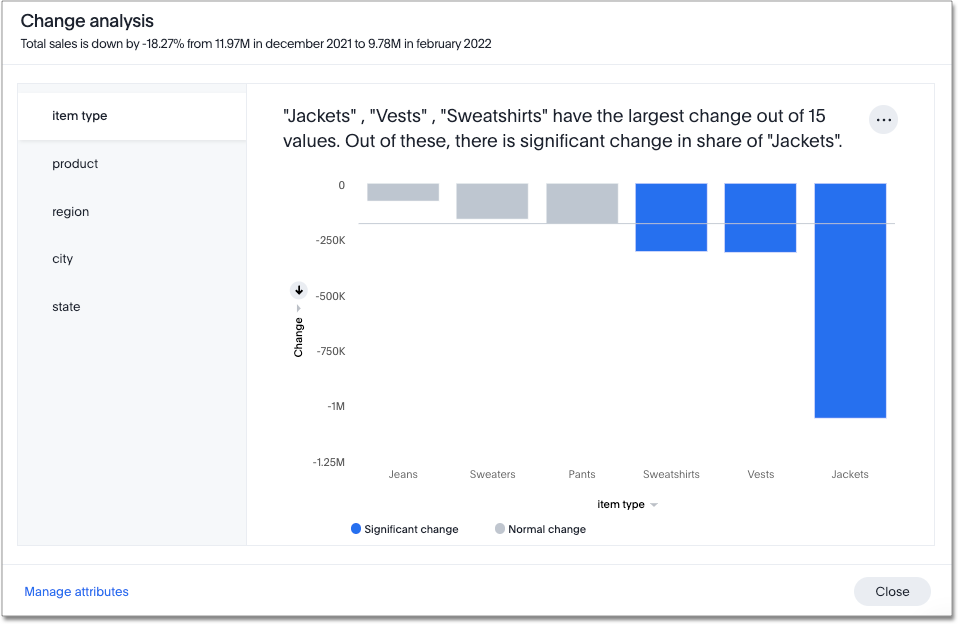
Custom groups Beta
You can now create custom groups, which can be used to classify values in a list you can then reuse across multiple analyses. As an example, you can use custom groups to search for which products are most popular, and define them by sales volume as "gold", "silver", or "bronze" level products. Custom groups are community objects which remain when you navigate away from the Search Data page and can be viewed by any user with view access to the underlying Worksheet.
For more information, see Custom groups.
Notification center
You now receive in-app notifications when items are shared with you, or when other users request access to an Answer or Liveboard. To view these notifications, simply click on the user profile icon. For more information, see Web notifications.
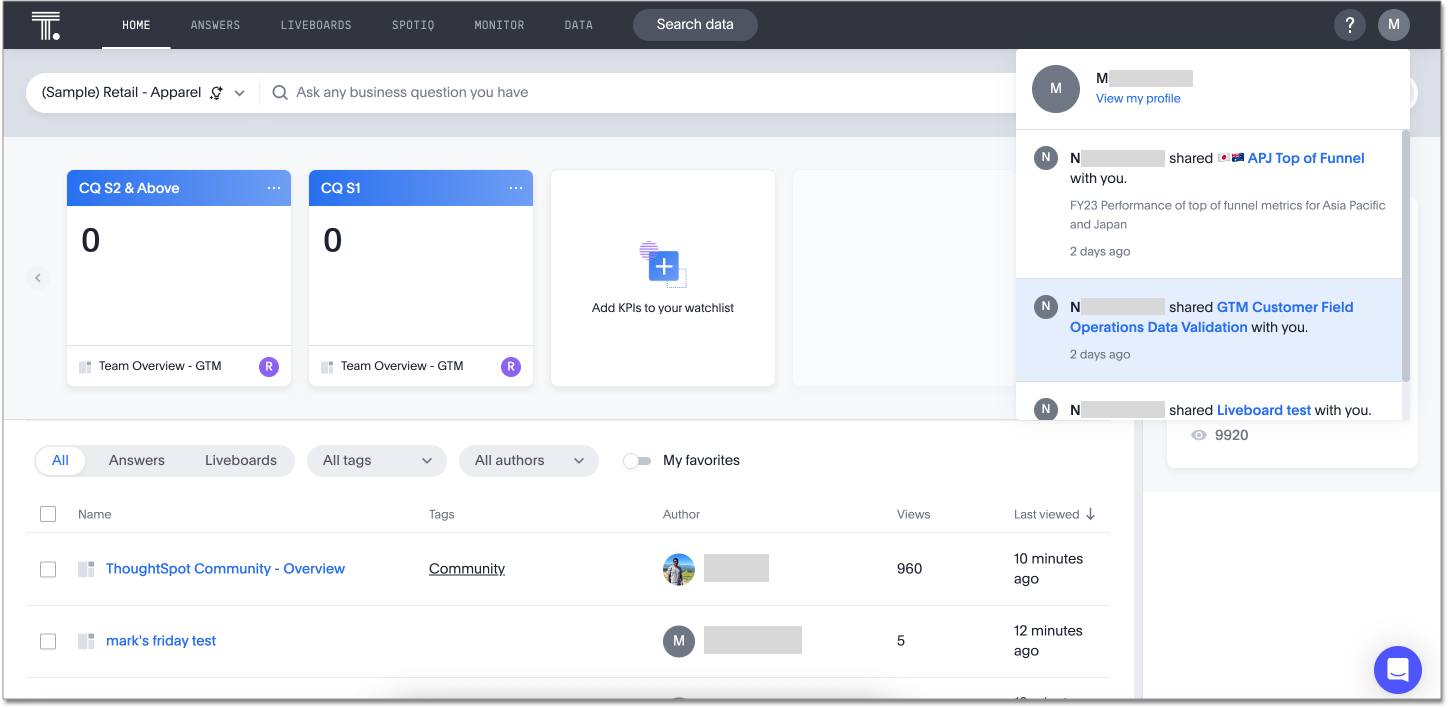
Verified Liveboards Beta
Admin-assigned verifiers can now mark Liveboards as verified. Users can now request these verifiers to review their Liveboards, and verify if the information displayed is trusted content. Verified Liveboards carry a tag that signifies that they have been audited for correctness. To enable this feature, contact ThoughtSpot support. For more information, see Verified Liveboards.
Geomap chart enhancements
ThoughtSpot now supports the following enhancements for geomap visualizations:
-
We now provide geomap data for all countries. For a full list, see Openstreetmap supported countries.
-
We now support multiple levels of subdivisions within a country, rather than just city and zip code.
-
We now support visualizations comparing subdivisions of multiple countries in a single visualization. For example, if a selected column contains data from cities in the United States and Mexico, all data would be displayed on a single visualization.
To enable these features, the Geo config property in the underlying Worksheet must be set to Auto select. All Worksheets created after 9.4.0.cl GA classify geographical data as Auto select by default.
For more information, see Geo chart enhancements.
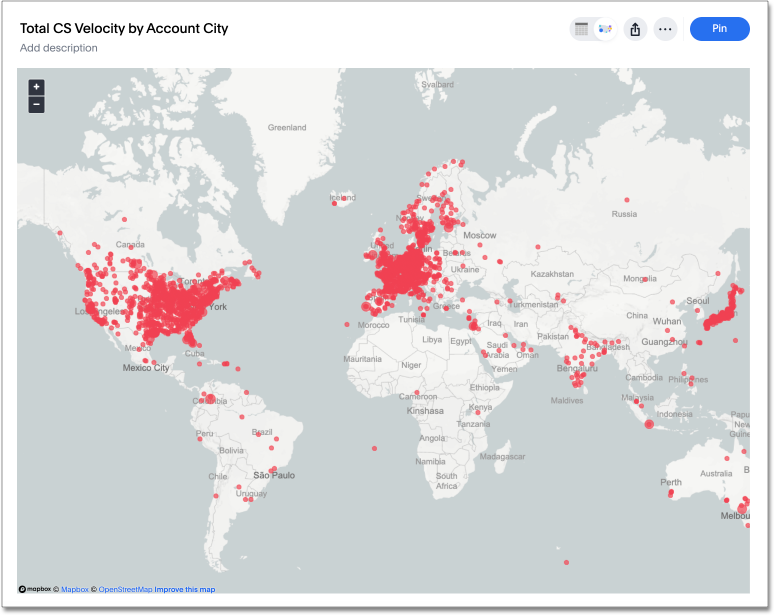
Date picker enhancement in Search Early Access
We added support for rolling, fixed, and custom date filters when creating an Answer or filtering a Liveboard. Previously, when adding a date filter to a Search, ThoughtSpot supported the conditions ON (=), ON OR AFTER (>=), BEFORE (<), and BETWEEN. Now, you can additionally filter for ON OR BEFORE (<=), NOT BETWEEN, ON LAST, and ON NEXT. To try it out, click the filter icon next to the Date column in the left side menu, or click the date filter below the Answer or Liveboard title. This feature must be enabled by your administrator. For more information, see
Date filters for Answers and Liveboards.
Headline creation and pinning deprecation
ThoughtSpot is deprecating the pin Headline to Liveboard feature. Beginning in the 9.4.0.cl Cloud release, users will no longer see the pin icon when they hover over table summaries. To visualize and pin single aggregated measures, attributes in string/date format, or time-series metrics with sparklines, you must create KPI charts. Existing Headlines pinned to Liveboards will not be affected in this release. For more information, see How to convert Headlines to KPI charts.
Show onboarding for new users following the share link
When new users receive a Share link and view the shared object in ThoughtSpot, they can now click the Keep exploring button to be directed to onboarding.
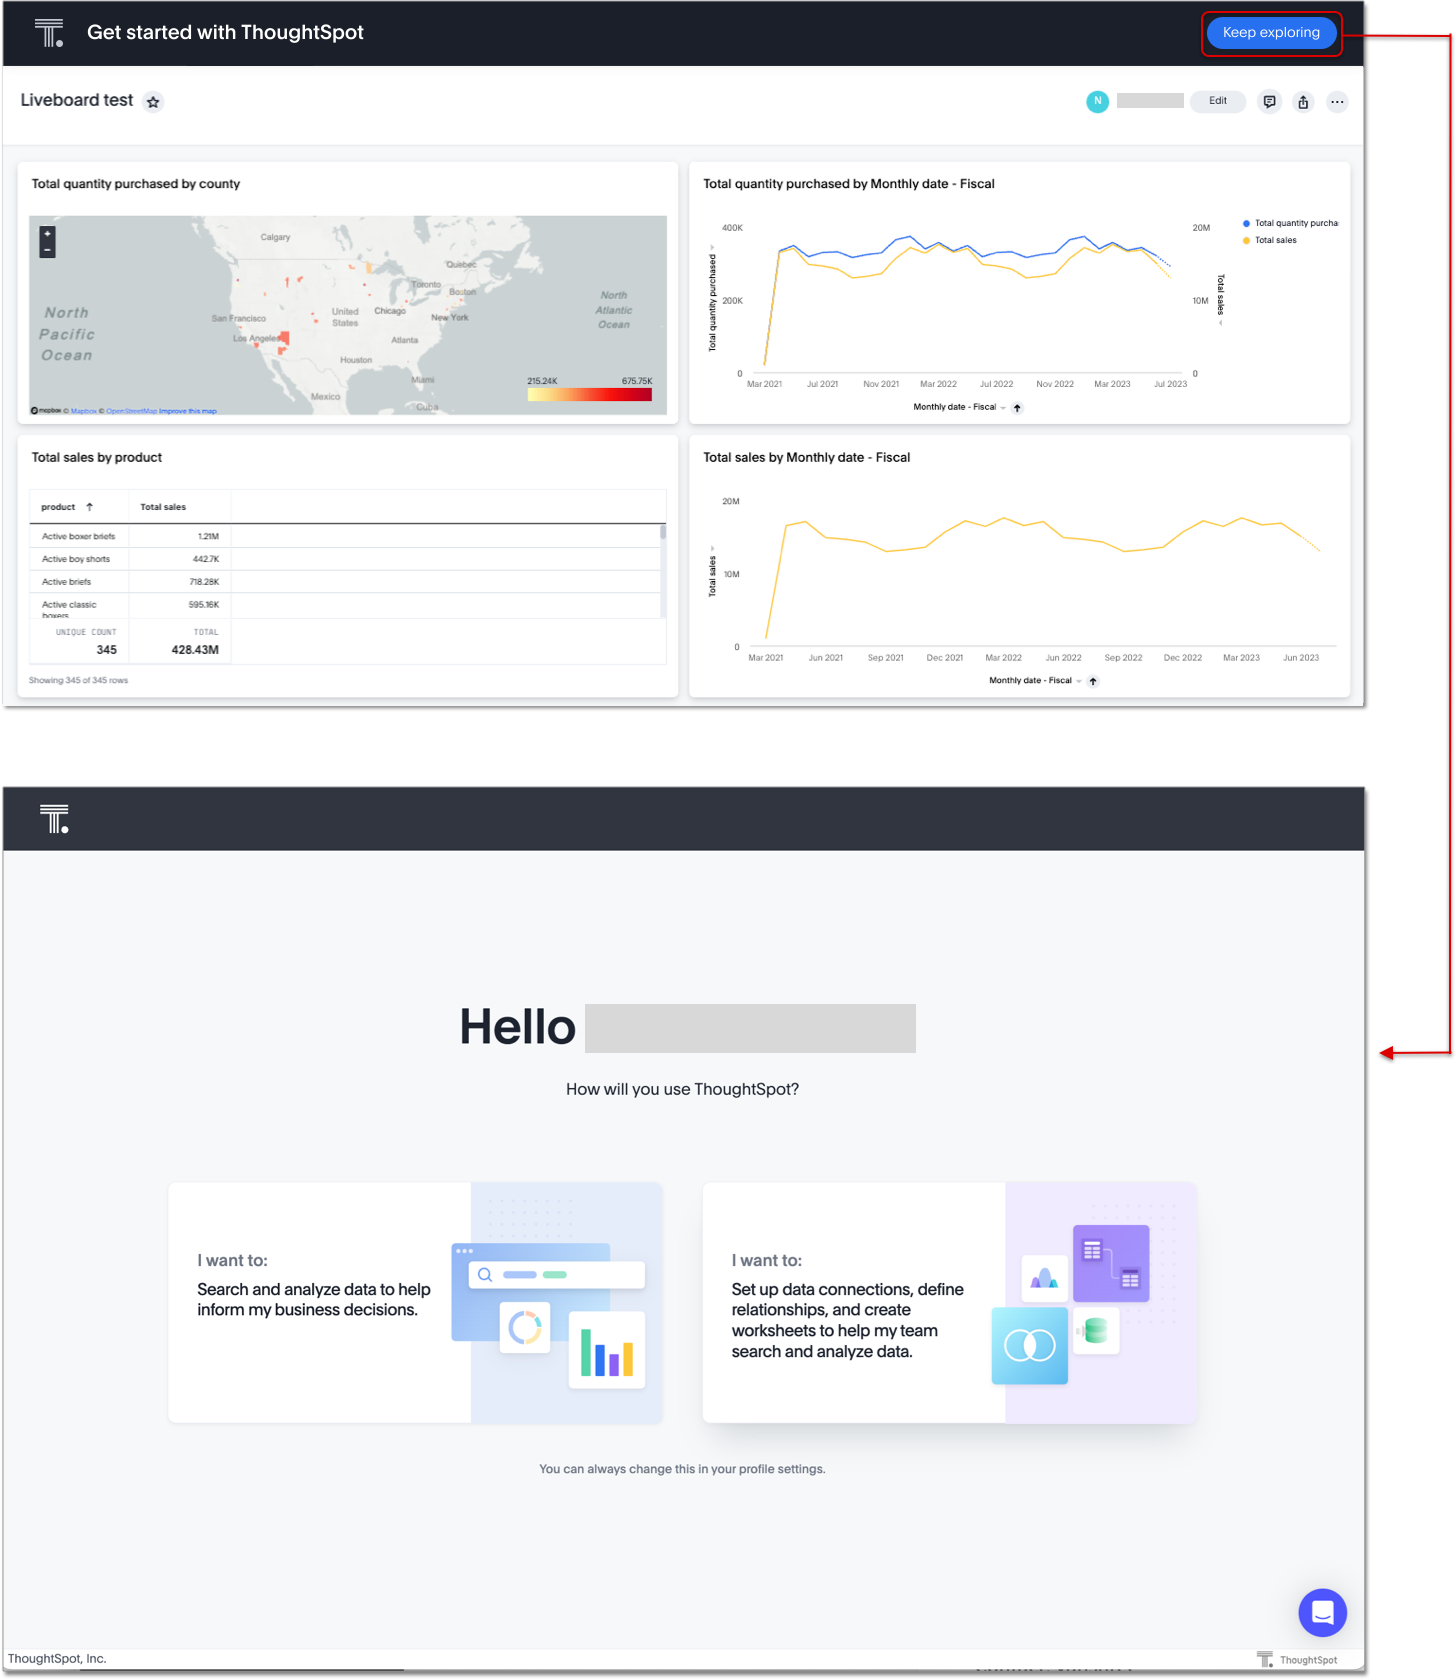
Other features and enhancements
Responsive Liveboards
We have improved the responsiveness of Liveboards. For windows between 1024 pixels and 500 pixels, the Liveboard columns respond to re-sizing. For windows smaller than 500 pixels in width, a horizontal scroll bar appears.
Liveboard tabs in Mobile app
We now display Liveboard tabs in the ThoughtSpot Mobile app. To create a Liveboard tab, you must access ThoughtSpot in a browser.
Worksheet formula indexing
In this release, worksheet formulas can now be indexed by setting Suggest values in search to Yes for the formula.
Admin controls for new data panel experience Early Access
ThoughtSpot admins now have more control for enabling the new data panel experience for users. In this release, admins can now make the new answer data panel experience default for all users of a cluster, by going to Admin > Search & SpotIQ and setting the Make new answer data panel experience default to Enabled.
Indexing Queries Liveboard
We introduced a Liveboard to answer the following questions:
-
How many indexing queries are made?
-
Which queries are failing and why?
-
How long are the indexing queries taking?
-
Which connections have the most failures so that the admin can easily identify them?
Admin users can access the Indexing Queries Liveboard by searching the Liveboards tab, and use the results to improve indexing queries performance. For more information, see Indexing Queries Liveboard.
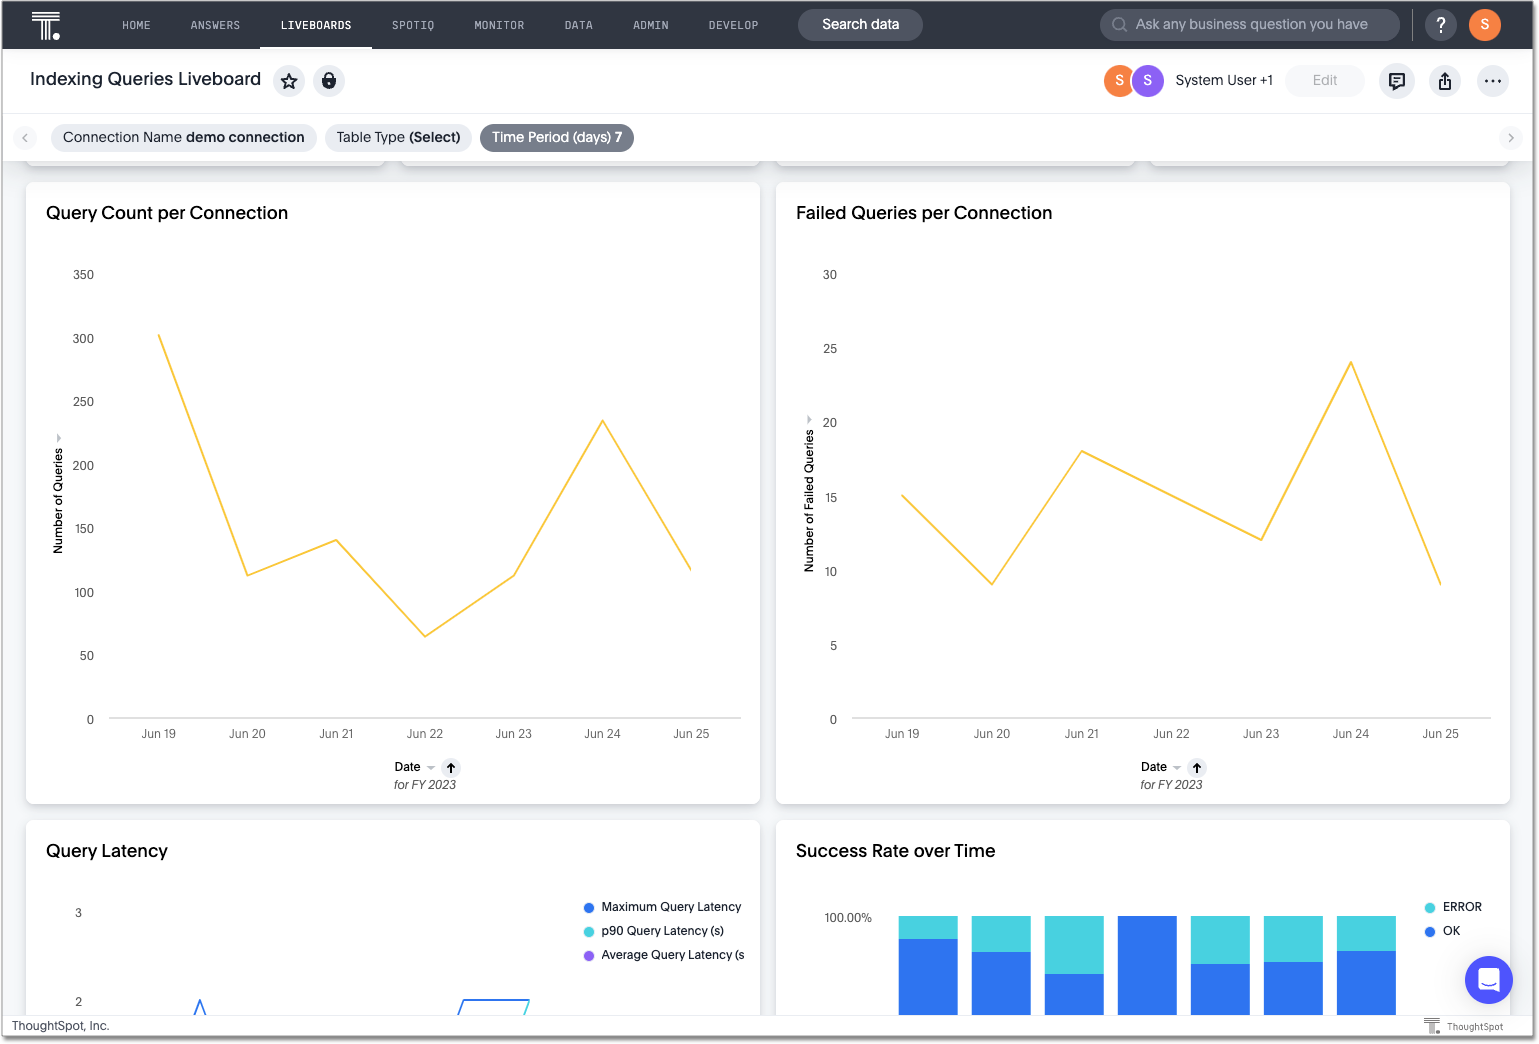
Snowflake Query Profile SpotApp
The Snowflake Query Profile SpotApp is now available. Use this SpotApp to analyze Snowflake query data to understand execution time better and pinpoint key areas for query optimization.
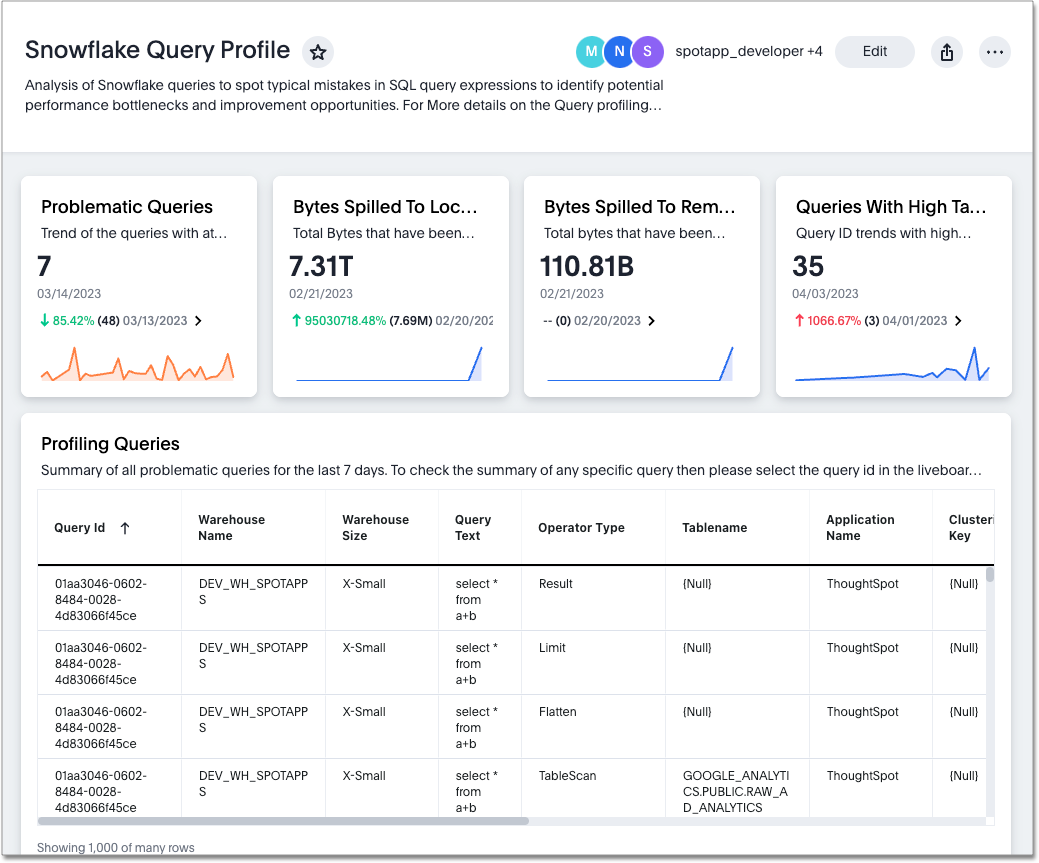
Connections
You can now create connections from ThoughtSpot to:
Connection error messaging improvements
If you run into an error while creating a connection, you can now click View details to see error details and add a comment for your administrator.
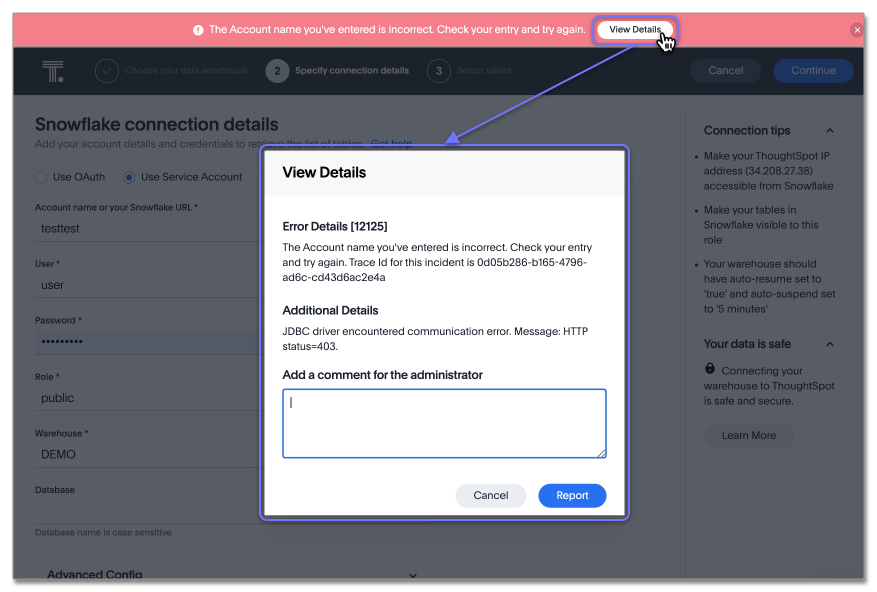
Table column case definition Beta
We are introducing the ability to specify the case of a table column (for example, upper, lower, or mixed). Previously, SQL generated by ThoughtSpot was always wrapped in a LOWER function with no configuration options. Now, users will be able to define whether columns in tables are mixed case or lower case. To enable this feature, contact ThoughtSpot support.
New London cloud region for AWS
ThoughtSpot Cloud now supports the London region when you connect using AWS. See ThoughtSpot Cloud requirements and support.
For the Developer
For new features and enhancements introduced in this release, see ThoughtSpot Developer Documentation.
9.3.0.cl
June 2023 9.3.0.cl
| Features marked as Beta are off by default. To enable them, contact ThoughtSpot support. |
ThoughtSpot Sage
In this release, ThoughtSpot Sage features are available for administrators to enable, without contacting ThoughtSpot Support. ThoughtSpot Sage makes it easier for you to get answers and insights from your complex data. ThoughtSpot Sage uses a combination of GPT-3, GPT-3.5T and GPT-4, and the large language models (LLM) of the Microsoft Azure OpenAI Service.
Sage features include:
-
Natural language search
-
AI-suggested searches
-
AI-generated Worksheet column synonyms
Sage features are disabled by default and available for administrators to enable in the Admin Console.
Once enabled, your ThoughtSpot administrator can grant access to the Natural language search and AI-suggested searches features for users in a group by assigning the Can preview ThoughtSpot Sage user privilege to the group. You do not need this privilege to access AI-generated Worksheet column synonyms. For more information about ThoughtSpot Sage, see ThoughtSpot Sage.
Natural language search
You can now search using natural language to access AI-generated answers to your business questions. This feature is now available for administrators to enable, without contacting ThoughtSpot Support. To try it out, navigate to the Home page, select the search bar labeled Ask any business question you have and type your question. When you enter your question, you will see the AI-generated answer appear, along with a list of related Answers created by users in your team. For more information, see Natural language search.
You can select the Worksheet to search on by clicking the Worksheet title in the left side of the search bar and selecting a new Worksheet from the dropdown. Worksheets with AI answers enabled display a triangular icon to the left of the Worksheet name: ![]() . See
Enable or disable AI-generated Answers.
. See
Enable or disable AI-generated Answers.
This feature must be enabled by your administrator.
AI-suggested searches
The AI-suggested searches feature is now available for administrators to enable, without contacting ThoughtSpot Support. This feature helps you think of relevant questions to ask of your own data source, by providing examples of searches. This feature is designed to help you get started if you are a new user of Search Data, or if you are working with a new Worksheet. This feature must be enabled by your administrator. For more information, see AI-suggested searches.
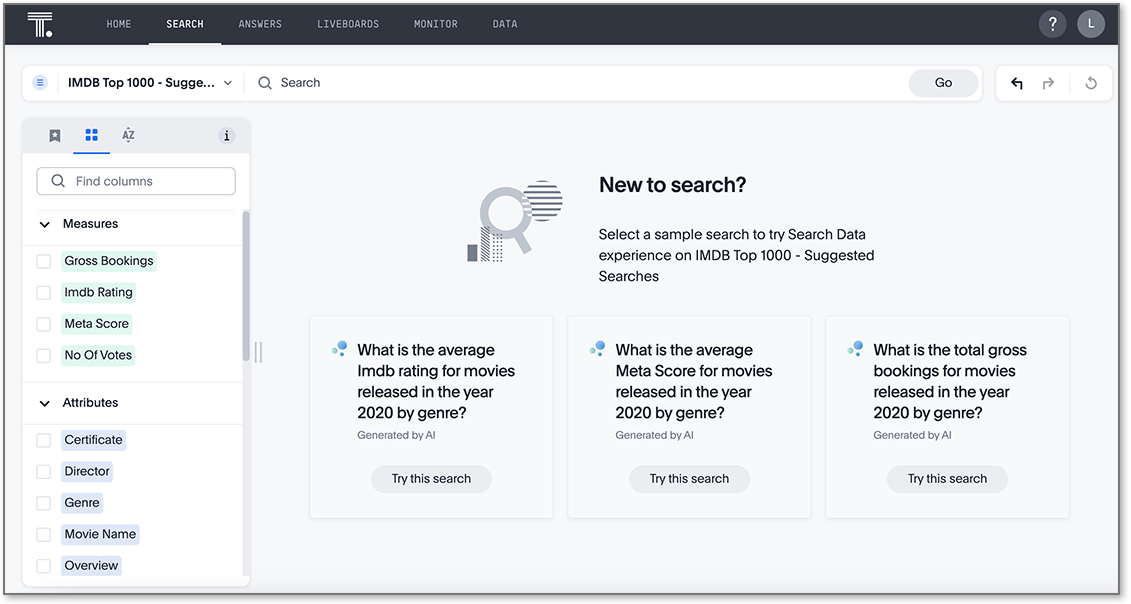
Liveboard cross filters
Liveboard cross filters are now GA. Right-click any data point in your Liveboard and easily filter the entire Liveboard by that value. For example, if you right-click California in a geo chart on your Liveboard, and then select Filter, all the other visualizations only show data from California. A visualization for Total sales by city, for example, would only show sales for cities in California. This feature is also called brushing and linking. To try it out, select any data point(s) in a Liveboard visualization, and select Filter from the menu that appears. For more information, see Liveboard cross filters.
Liveboard note tiles
The Liveboard note tiles feature is now GA. Add notes to your Liveboards, so that viewers of your Liveboards can quickly understand how to use the data and visualizations you gathered. Note tiles can provide an overview of a Liveboard or visualization, company branding through images, definitions of terms used in the Liveboard, and so on. With the GA of the note tiles feature, you don’t need a specific privilege to upload images. To try it out, edit a Liveboard, and select Add note. For more information, see Liveboard note tiles.
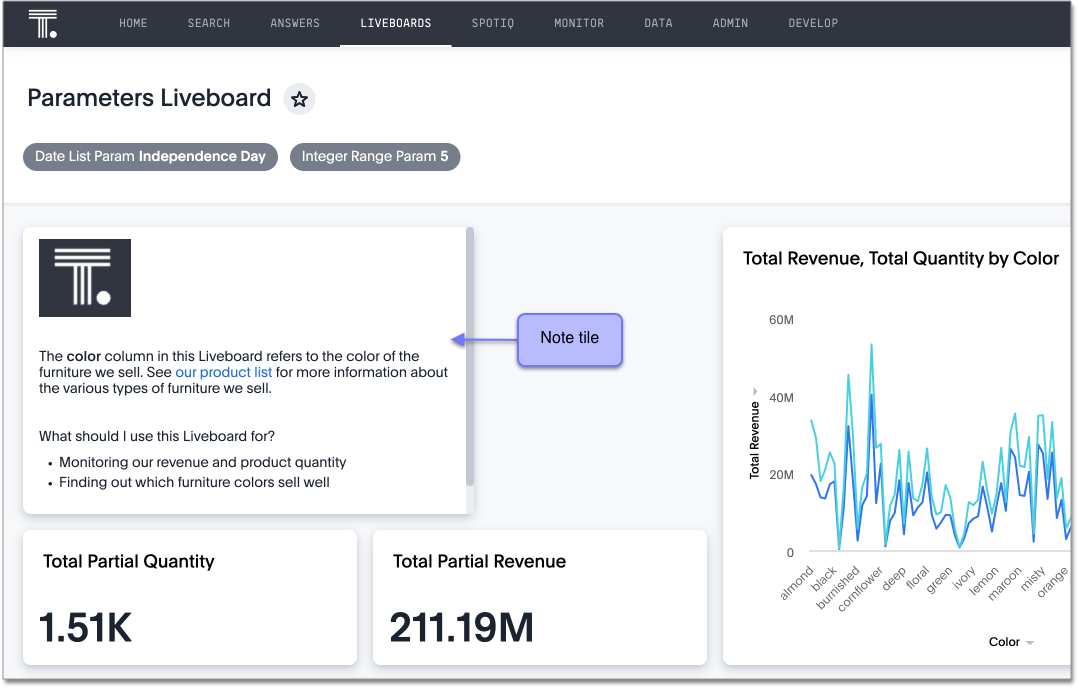
Contextual change analysis
You can now identify the key change drivers for changes in your metrics in a KPI chart. This feature is now available for administrators to enable, without contacting ThoughtSpot Support. Select the percent change label or select any two data points on the KPI sparkline to view change analysis on your top 5 columns by usage-based ranking (UBR) and identify the reason behind the observed change. You can view the changes in other columns by clicking Manage attributes and selecting the desired column(s). This feature must be enabled by your administrator.
For more information, see Contextual change analysis.
Attributes in pivot table cells
You can now include attributes in the pivot table cells as well as measures. This is useful for cases when you want to summarize text data such as user role, pass/fail, or other attributes. For more information, see Pivot table charts.
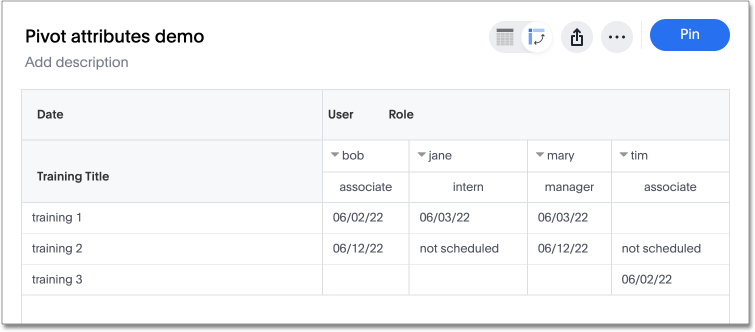
Change the filter order for Answer filters
Arrange Answer filters in the filter bar so that they are in a logical, coherent order, by dragging and dropping them to different spots in the list. This makes it easier for viewers of the Answer to understand and use the filters on the Answer. To try it out, open any Answer, and drag and drop the filters in the filter bar. For more information, see Change the filter order.
Keywords "of", "percentage of" Beta
To enable business users to answer questions related to mix, contribution, share of, percentage, and total ratios, we added the keywords "of" and "percentage of". These keywords help answer questions such as "What is the share of a certain store’s sales as a percentage of the regional whole?" Previously, searches such as these required the use of a group aggregate formula, which presented a barrier to users. To try out this feature, enter a search phrase in the search bar containing the keyword, such as sales percentage of store region, and press Go.
For more information, see Keywords: Of and Percentage of. This feature is off by default. To enable it, contact ThoughtSpot support.
Liveboard header visible when you scroll down
When you scroll down in a Liveboard, the Liveboard name, menu options, and filter and tab bars remain visible. You don’t need to scroll back up to the top to edit the Liveboard or check your filters. You can see the filters or parameters applied to the Liveboard, select the Edit button or more options ![]() menu, and view which tab you’re on from any spot in the Liveboard. To try it out, open any Liveboard, and scroll down.
menu, and view which tab you’re on from any spot in the Liveboard. To try it out, open any Liveboard, and scroll down.